Education ∪ Math ∪ Technology

Month: July 2013 (page 1 of 2)

What are effective learning experiences for educators?

A question which is always on the back of my mind every time I attend a conference, give a presentation, or work with my colleagues, is how much are we all learning?

Teacher learning diagram

Just like there are less and more effective activities for learning for students, the same is true of teachers. Above is a diagram with different learning activities, arranged from what is probably least effective (toward the bottom) to what is probably most effective for teacher learning. Note: I know of no evidence which would allow me to effectively rank these activities from least to most effective, and if none exists, that should worry all of us.

An observation I have is that the items on the bottom of this list are much more expensive than the items on the top of this list. In fact, we are quite likely spending many millions of dollars each year, as a profession, on activities which make very little difference on our learning, and through us, student learning.

The things are the top of the list are largely directed by teachers for themselves, and require significant investment from teachers in terms of time. How can we do a better of supporting teachers’ learning?

This reflection is prompted by the incredible learning I felt took place at Twitter Math camp, which may have been one of the conferences from which I learned the most during my entire career. How can we get more teachers involved in teacher led professional learning with supportive and encouraging peers?
Presentation on Powerful Learning in Math via Programming

These are my slides from my workshop at Twitter Math Camp on Powerful Ideas in Math via Programming.


I recommend opening up the speaker’s notes and trying out the challenges and activities given. You can use Blockly to experiment with different code, but my suspicion is that you will learn more from the experience if you don’t run the completed code until you are pretty sure you know what it does. Let me know how you do with the challenges and activities if you try them. It will also be useful for you to frame your activity with, "what does affordances for thinking does this programming environment offer?"

The medium is the mathematics

Mathematics is not medium neutral. What we call the mathematics that we can do with pencil and paper is different than what we can do with a computer and call mathematics, which is different again than the mathematics we can do with origami. The medium defines the mathematical space, in the same way that Marshall McLuhan talks about the medium being the message.

There is certainly overlap between pencil & paper mathematics and computer mathematics, but there are also differences, and more importantly, each medium has mathematical constructs which are either more difficult or even impossible to express in the other medium. In the same way that people switch between languages to express ideas that cannot easily be expressed in another language, the same is true of mathematics. It is perfectly natural that some mathematics is more easily represented in one medium, and some mathematics is more easily represented in another medium. This is the nature of mediums for communication.

Dan Meyer gives as an example of something which is challenging to create with a computer:

Use a computer to compose a clear proof that a triangle’s medians create similar triangles and send it to me for assessment.


As another example of this challenge of mathematical representations in different mediums, I offer this:

Draw the Mandelbrot set with pencil and paper.


What changed my teaching

Adam Holman asks a really important question:

What have you found to be the catalyst that helped either change your mindset/practice or helped change a ‘traditional’ teacher into one that cultivates relationships and student choice?

When I first started teaching, I talked too much. I really did. I spent too much time trying to clarify every permutation that could possibly come up, and not enough time letting students think about those permutations themselves.

However, over time, I experimented with different approaches. I wanted to find out what would work best for my students. I would try out a new project or a new instructional activity, and I would look at those activities critically to see what about the project or activity worked, and what didn’t work. If possible, I would try and fix what wasn’t working while keeping what was.

During the time I have been a teacher, I have noticed these (and other) things:

  • The less I talk, the more time students have to grapple with mathematical ideas. Some talk is okay, but the balance should always be in favour of the students.
     
  • Motivation and engagement are important. A student who believes that their ideas matter, and who is genuinely interested in what they are doing, learns far more effectively than otherwise.
     
  • Students build persistence in mathematical problem solving most easily by working on problems and projects that are easily chunked and somewhat open-ended in terms of method, but have a clear goal that they can work toward.
     
  • Discovery of mathematical ideas helps promote student ownership over their learning. A well-structured task through which students are likely to make mathematical discoveries for themselves leads to students who have a different mindset on mathematics. Does every topic lend itself well to discovery? No, but a great deal more do than most people might think. After all, every mathematical idea that we teach was discovered by someone, sometime.
     
  • Peer collaboration is a chance for students to make connections and get feedback on their ideas and it takes time to develop effective math talk between students. There is only one of me, and there are so many students, so the potential for feedback is greater when students discuss mathematics with each other.
     
  • An important objective of mathematics class is to develop mathematical reasoning in students. Most of them will forget whatever mathematics they learn eventually, but we hope that their core mathematical reasoning stays with them forever.

However, I would not have noticed these things if I did not take the time to reflect on my practice and look for evidence of what worked for my students, and what did not.

My advice therefore to Adam is that he try and have teachers start on a road of reflection and inquiry into their own practices. He may have to tackle some of their misconceptions about student learning directly, which is where 5 minutes talks like the one by Steve Leinwand are useful but the teachers with whom he works will learn most effectively from each other, from reflection on their own practice, and from seeing other possible ways to teach.

Using Angry Birds as a Context for Quadratic functions

One of the teachers I work with used Angry Birds as a context for learning about quadratic functions. Whenever they wanted to introduce a new topic, they referred back to the context of Angry Birds so as to give students a representation of quadratics with which the students may be familiar.

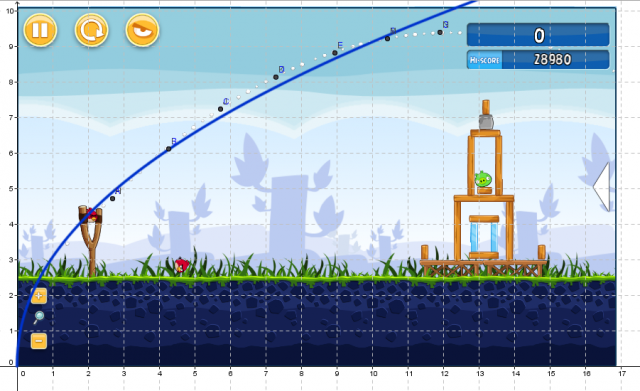
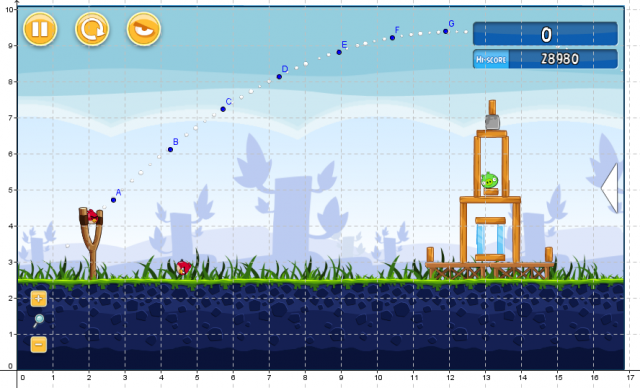
Let’s see what that could look like. Here’s one angry bird shot.


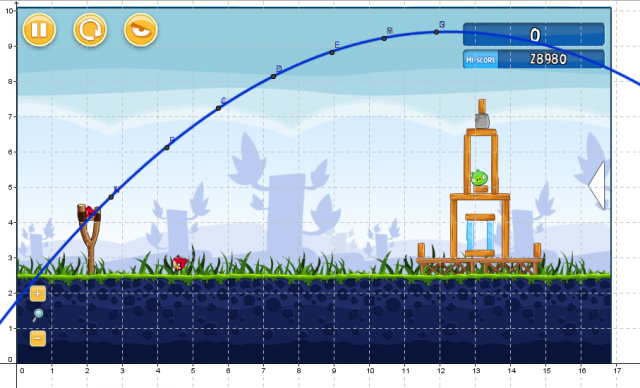
Here’s the data from the shot above inputted into Geogebra.

Angry bird as graph


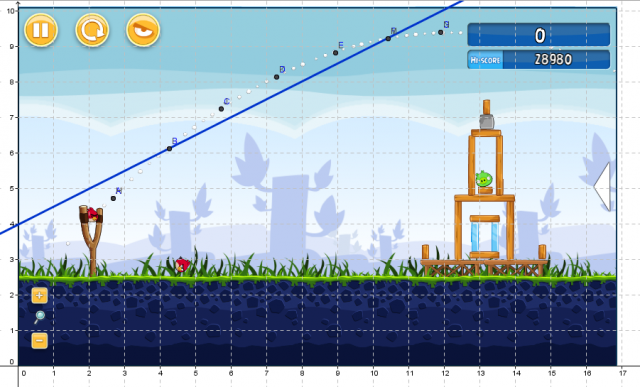
You could then use this graph to ask a lot of questions, particularly about the shape of the flight path of the bird. Does this shape look like a line? Why or why not? Have you seen this shape before? What is important about this shape? What do you notice about this shape? Many of these questions would naturally lead into the types of things that might be addressed in a unit on quadratic functions.


You could use the Three Acts format Dan Meyer has produced and use the medium of Angry Birds to ask questions. What questions do you have after watching this video? Which of those questions are mathematical? What information do you need to answer those questions?


Which of the following graphs best fits the data given? Why? What are some problems with this fit to the data?

linear regression

power regression

polynomial regression


What questions do you have after watching this video?


This last video presents some challenges for the students. The video zooms in and out, which means that when students are collecting data, they will need to find a way to account fo the scale differences between the different shots. This requires them to use skills that they probably haven’t used in this context, and for algebra students, they may not have used proportional reasoning in a while.

If I were using this in a class, I might try and reframe the problem in terms of a real life catapult, and see if students can transfer what they have learned from studying quadratic functions in the context of Angry Birds to the motion of their catapults, perhaps with some sort of challenge to knock over a popsicle stick tower.

Six things about math education which do not work

There are six things (at least!) about mathematics education which do not work:

  1. pacing for coverage of curriculum rather than focusing on effective student learning,
  2. fear that if students take more than five seconds to solve a problem, they will give up,
  3. teachers spending more time talking than students get to spend thinking,
  4. teachers working in isolation to plan lessons, units, and understand their students,
  5. students being forced to work in isolation from their peers as potential resources,
  6. and an obsession with procedural fluency over conceptual understanding.

The objective of my current work is (collaboratively with the rest of the members of my team at New Visions) to develop tools for teachers that will help address as many of these issues as we can. These tools will be used collaboratively with teachers to look at student work and try to address the question, "What were these students probably thinking?" and "How can I help this student further their understanding of mathematics?"

[Three Acts] Stopping Distance Makeover

Act One

Show this video. Ask students what questions they have. 


Act Two

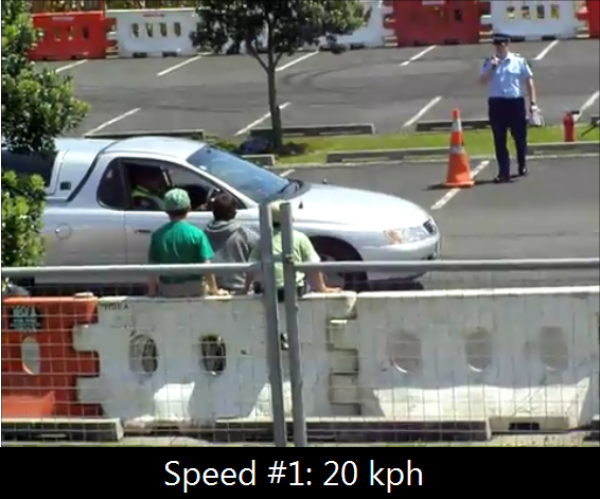
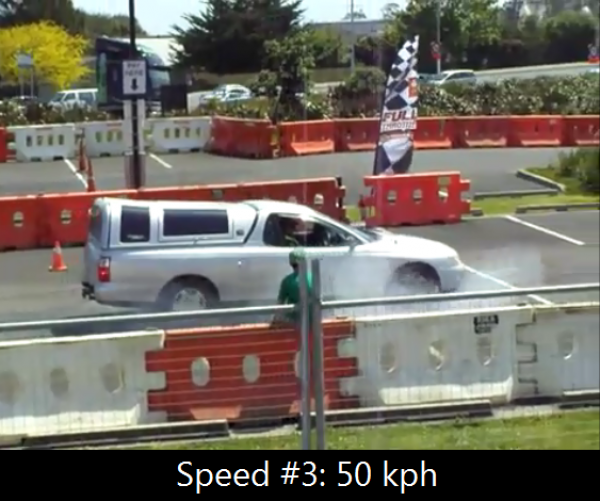
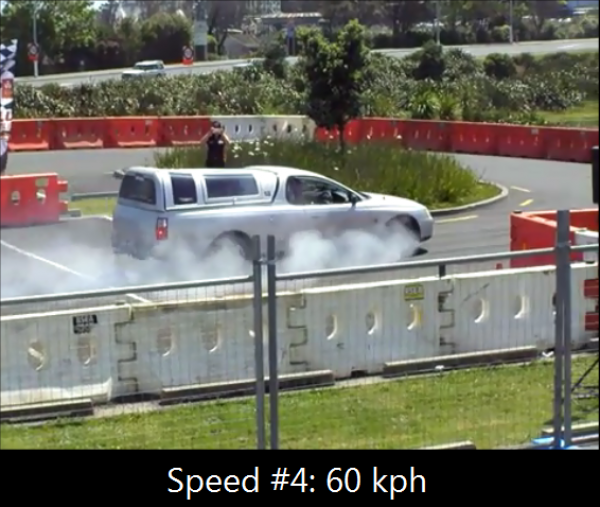
Give the students these photos. From these they should be able to figure out the distances travelled by the car, but you may wan to point out those handy reference points in the background (hint: the parking spots).


Act 3

Chart of relationship between stopping distance and speed

I don’t know exactly what Act 3 should look like. Would a graph make the most sense? A function in standard form? Would an image overlay of the car in all four positions work the best (I don’t have the tools to make this on my current computer)?

Unsubscribe

I have for some time now been subscribed to too many sources of information. As part of my transition to a new job, I have been culling various items in my feed. This is based largely on the fact that my role as an educational technologist is greatly diminished and I have less need to know about such a wide variety of tools. My focus will be much more on mathematics education, and while I think there is a role for technology to play, I think the number of tools which have potential use is much smaller.

I also recently created a list of people (on Twitter) who help teachers learn how to improve their teaching of mathematics and I enjoy being able to see the conversations that happen, usually without any hashtags. For three years I have followed hashtags and only noticing conversations between people I follow on Twitter when those conversations include a hashtag. When I created this group, I realized I missed the random conversations.

On Twitter, I unfollowed 12,000 people manually. It took 15 hours to do and most of it happened after the kids and my wife were asleep. Yes, I know that there are tools that I could have used to unfollow everyone automatically, and then I could rebuild my list. I think this would have taken more than 15 hours to do.

I glanced at each person’s bio (if they did not have a bio and I didn’t remember them, I generally unfollowed them), and asked myself these questions as I chose whether or not to continue following them:

  • Do I know this person outside of Twitter?
  • Do I remember interacting with this person in Twitter in any meaningful way?
  • Are they involved in mathematics education?

If the answer was yes to any of these questions, then I continued following them. This left me following about 2700 people. 

I’m sure I made some mistakes and unfollowed people that matched my criteria. I was tired, please forgive me and (gently) point out to me that I should continue to follow you. I also hope no one thinks that this list of 2700 people are "better" than the people I unfollowed. They aren’t. They just more closely match what I am hoping to get out of using Twitter.

The Faulty Logic of Disrupting Class

I am reading Disrupting class, by Clay Christensen, Michael Horn, and Curtis Johnson. In the introduction of Disrupting Class, Clay Christensen, et al., give six possible reasons for why the United States education system does not appear to be doing well when compared with other OECD countries:

  1. Schools are underfunded,
  2. There aren’t enough computers in the classroom,
  3. Students and parents are to blame,
  4. The U.S. model of teaching is broken when compared to other models in other countries,
  5. Teachers’ unions,
  6. The way we measure schools’ performance is fundamentally flawed.

Unfortunately, this is a good example of how the question asked frames the answer (Question asked: Why isn’t the United States doing better in education compared as a whole to other OECD countries?).

When you compare the United States education system as a whole to other OECD countries (using PISA data, for example), you find the United States appears to be in about the middle of the pack. However, if you disaggregate PISA data and look at a state by state comparsion, and then compare each state to other similar OECD populations (in terms of average income), you find quite a different story. The high income and low income areas of the United States hold their own against comparison OECD countries. but the United States has a much higher poverty rate than most OECD countries, which results in an over-representation of low-income students in the aggregate U.S. data.

We know that all students can learn, when they are given the supports they need, so a better question for Christensen, et al., to ask is; why isn’t the United States doing more to combat the effects of poverty on its most vulnerable population?


Other notes:

In chapter 1, Christensen, et al., use the idea of multiple intelligences and learning styles to suggest that it is incredibly challenging for a teacher in a classroom to succeed at teaching all of his/her students. Unfortunately, recent research on learning styles and multiple intelligences suggests that they are not a useful framework for understanding student learning (except that all students probably benefit from experiencing ideas in different mediums).

In chapter 5, Christensen, et al., make the claim that their calculations show that by the year 2014 student centric learning (aided by technology) will become mainstream. The authors of Disrupting Class should probably have talked to teacher colleges before writing their book, where training teachers to use student centric approaches has been mainstream for decades.

Introducing vocabulary in a digital book

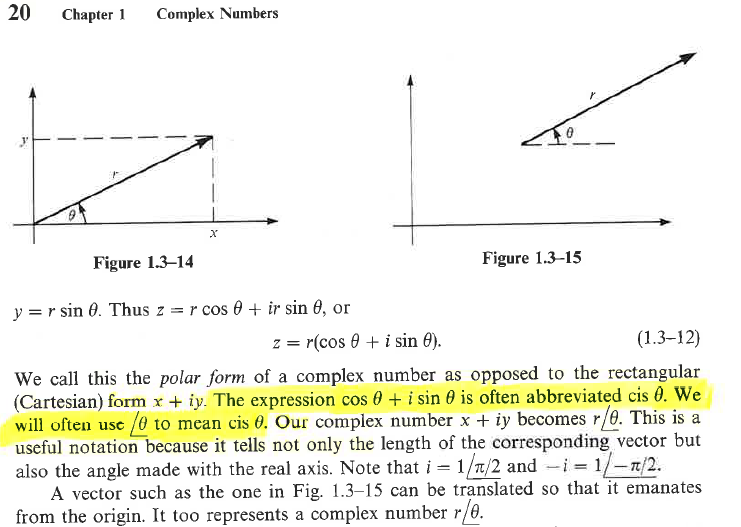
Example from Complex Variables textbook

(Source: Complex Variables with Applications, Second Edition, A. David Wunsch)


I started transporting my professional books to my new office this week, five books at a time. One of the books I brought today was my old textbook from when I took Complex Analysis in university, about 20 years ago. I decided to skim through the book to see how much of those two courses I remember, and as it turns out, the answer is not much.

I stumbled upon this notation that I was unfamiliar with very early on in the textbook, and decided to work my way back through the textbook to see if I could find out where this notation was introduced, and found the only reference to a definition of the notation above.

It occurred to me that this is not so much a failure of the author, but a failure of the medium, and one that could be addressed in a digital medium much more easily. One cannot easily link to notation, especially notation used often in a traditional textbook, back to it’s origin. However in a digital textbook every single instance of this notation could be made linkable (perhaps in an unobtrussive way so as not to be distracting) back to not only the first instance of the notation, but to carefully constructed examples of the notation in use.

On a related note, in my classroom, I try my best to introduce vocabulary and notation as it is needed to describe mathematical (or otherwise) objects that the students have been gaining some familiarity with. This way the vocabulary or notation is meeting a need; labelling something that we want to discuss, rather than being artifically introduced "because we will need to know this later."