One of my jobs at my current school is work on mathematics enrichment projects with three 4th grade students. For the past couple of weeks, in between their camps, my camp, and other end of year events, we have been working on looking into a mathematics modelling task, specifically, a fork catapult. The 4th grade boys and I completed this project over a series of 3 lessons with me, and 2 more lessons working on it independently between our sessions.
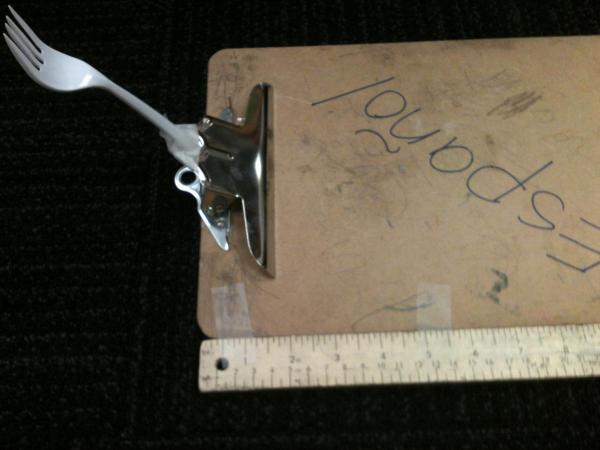
I built the fork catapult fairly quickly for the boys, mostly because we lacked a lot of time to work on this particular project, and partially because I wanted them to focus on the collection of data, not specifically the design of their catapult (As it turned out, the boys found time to create three more of their own designs anyway).
I set up the catapult, starting opening up the clip on the clipboard, and right away one of the boys asked, "I wonder how far it will go?"
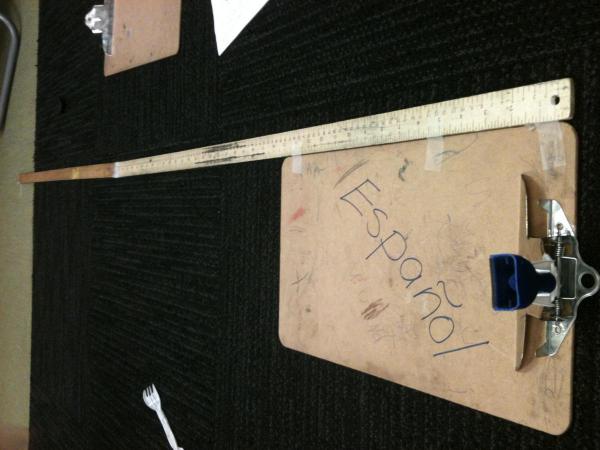
So, we collected data. What we did was open up the clip part of the clipboard so that it was 1cm, 1.5cm, 2cm, 2.5cm, and 3cm open, and shot a mini-whiteboard eraser by releasing the clip, 10 times for each position of the clip. We then measured the distance (as accurately as we could) the eraser flew across the room. The initial prediction from the boys was that the wider the clip was open, the farther the eraser would fly, which the boys continued to believe, even once we had actually collected all of the data.
I showed the boys how to plot 1 or 2 points, and then I then asked them to carefully graph the rest of the data. This is what they produced (the red dots were added later).
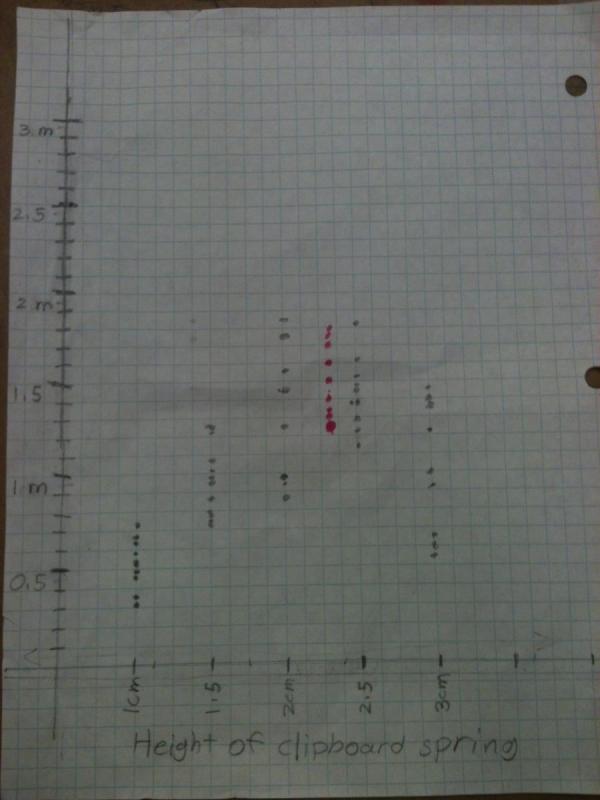
Once the boys had their data graphed (do you see the small error in the graph above?), we looked at together to see what it meant. From the graph, the boys decided that it was clear that their initial hypothesis (they didn’t use this language, I did) was incorrect and that there was a maximum distance that the eraser could be launched. One of the boys had the insight that the problem was that when the clip was "open too wide" that too much of the energy went into throwing the clip up, and not enough went into catapulting the clip forward.
The boys also reasoned that the eraser would be shot the furthest when the clip was between 2cm and 2.5cm open. Our next step was to test their new hypothesis. As you can see from the red dots graphed above, their hypothesis was probably right, although in order for the boys to see that, we first had a discussion about finding average values from the graph.
At the end of the second class, we started cleaning up, and the boys asked me to photocopy their graph and data, and let them take home their other catapult designs. One of them said to the other boys, "Let’s keep working on this next year!"
There are a lot of ways one could go with this project, but one thing I really liked about it was that we created a mathematical investigation from some pretty basic supplies, that the data that results has enough experimental error that it makes it more obvious that collecting many trials is useful, and that the graph was clear enough that students could read the results from the graph fairly easily.
Christina Major says:
David is no doubt a great mathematics teacher. His way of teaching is really good. I can myself relate to this post as I myself loved to create mathematical models when I was in school. He has explained the project in an interesting manner here.
July 3, 2013 — 10:56 am