Visual patterns are a way to introduce and extend students’ understanding of algebra and functions. As such, there are a number of principles for helping students better understand algebra by examining visual patterns that have the same structure as their algebraic counterparts.
Principle #1: We can use the visual pattern to give more meaning to the algebraic structure.
What do you see changing in the pattern below? What stays the same? How is this pattern related to algebra?
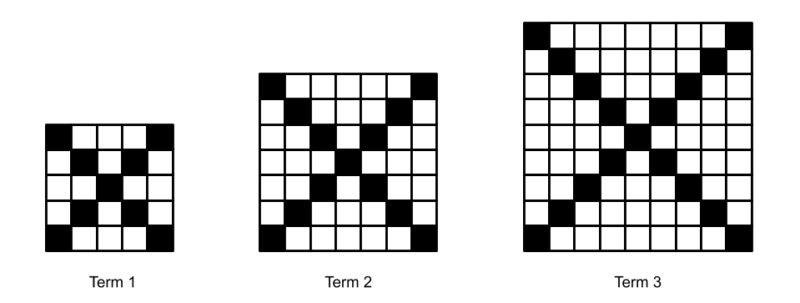
In the pattern above, children are likely to describe the squares as growing from left to right. They’ll notice that the diagonals of the squares are shaded and that the squares are two longer each time.
Each of these observations can be described in terms of equations based on the term number. For example, a child might notice that each square has 4 arms and 1 center square shaded, so you might annotate the diagram to show the arms and the center square.
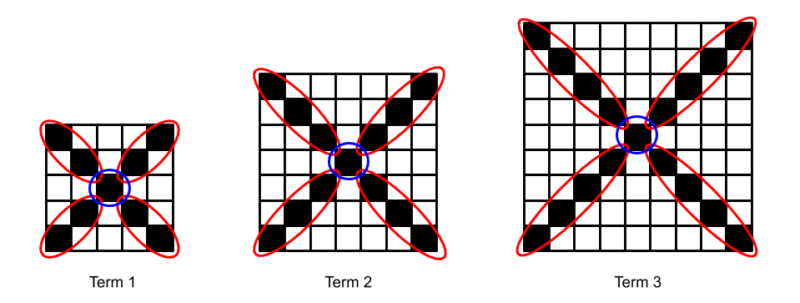
Another child notices that the length of each arm is one more than the term number and that the total number of black squares is 4 times this length plus one additional square. Algebraically, this is represented with S = 4(n + 1) + 1. We color the parts of this equation to correspond with the visual to make the connections more clear. By doing this, we assign meaning to each part of the expression based on the visual.
Principle #2: We can use visual patterns to justify algebraic relationships.
Visual patterns can also be used to give meaning and to justify that a particular algebraic relationship is true, beyond what is possible to do with pure algebraic reasoning alone or a single visual example.
One might start by giving students the following image and asking them what they notice about the image.
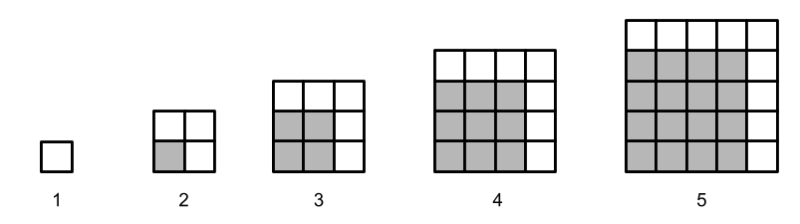
Collectively, students will notice that there are five squares, each square is larger than the square before it, each square is composed of smaller squares, each square has the square before it embedded in the lower left-hand corner, the number of white squares added on each time is odd, and a whole of other mathematical and non-mathematical observations.
The observation that each square is embedded in the next square and that the number of white squares added each time is an odd number can be written as follows.
1² = 0 + 1 = 0² + 1 = 1
2² = 1 + 3 = 1² + 3 = 4
3² = 4 + 5 = 2² + 5 = 9
4² = 9 + 7 = 3² + 7 = 16
5² = 16 + 9 = 4² + 9 = 25
By starting with the visual, students can reason inductively that “each square is just the square before it plus an odd number” and then this reasoning can be represented algebraically as n² = (n – 1)² + (2n – 1).
Principle #3: Visual patterns can be used to help students understand some of the language used in algebra.
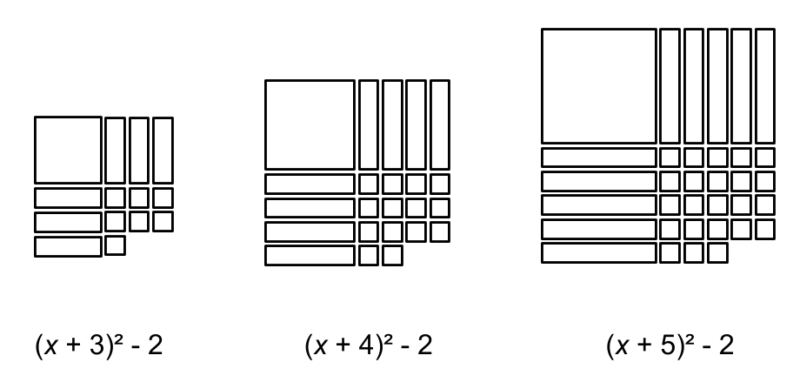
I did not learn during high school why “Completing the Square” was called Completing the Square. It wasn’t until I started teaching the idea using a visual to represent the square1 that the language made sense.
Principle #4: Visual patterns can be used to distinguish between different algebraic functions2.
Look at the two patterns below. How is each pattern changing as it increasing? How are these changes different between the different kinds of visuals?
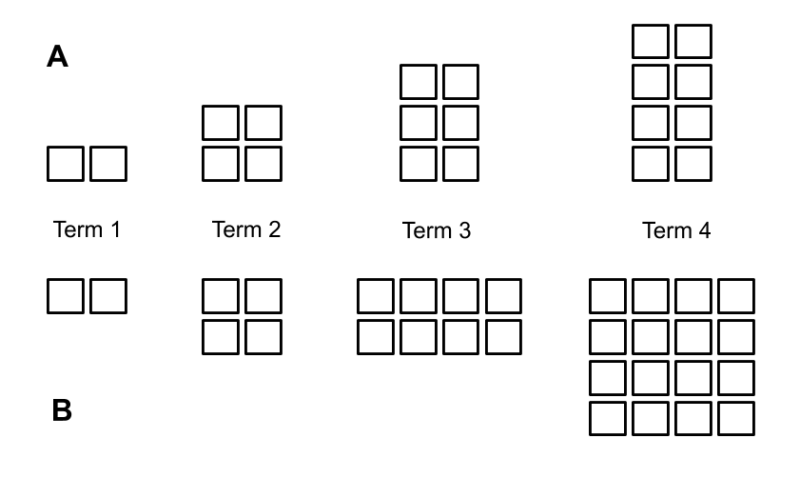
By using patterns we can more easily contrast the difference between y = 2x and y = 2x which in written form are far more similar the corresponding visual sequences.
Further resources and inspiration:
- Bob Lochel wrote about how he used an area model to teach Completing the Square in detail.
- Here is a resource I designed with this principle in mind.
Erika says:
I really liked how you explain it , do you have videos where you explain it.? I need to listen to the explanation thanks
June 16, 2020 — 5:42 pm
David Wees says:
Hi Erika,
I do not have any videos related to this topic at this time. Sorry!
David
June 16, 2020 — 5:50 pm
Joy C says:
Really nice. Thank you.
January 21, 2021 — 6:48 pm
Betsy T says:
Is there an error in your formula for principle #2? I think the purple portion of the formula should be 2n – 1 instead of 2n + 1.
If n = 5, 25 = (5-1)squared + 2 x 5 -1
25 = 16 + 10 – 1 not plus 1
right?
March 4, 2022 — 4:14 pm
David Wees says:
Yeah, you are right. Good eye!
July 22, 2026 — 1:28 pm