Education ∪ Math ∪ Technology

Tag: math (page 1 of 10)

Ways to use technology in math class

Here are some ways you can use technology in your math class which are more interesting and innovative than using an interactive white board or having students watch instructional videos. Note that these ideas are all examples of potential student uses of technology.

Students could:


Any other suggestions of ways students can use technology in order to improve their mathematical reasoning?

DIY Catapults!

Fork catapult - side view

One of my jobs at my current school is work on mathematics enrichment projects with three 4th grade students. For the past couple of weeks, in between their camps, my camp, and other end of year events, we have been working on looking into a mathematics modelling task, specifically, a fork catapult. The 4th grade boys and I completed this project over a series of 3 lessons with me, and 2 more lessons working on it independently between our sessions.

I built the fork catapult fairly quickly for the boys, mostly because we lacked a lot of time to work on this particular project, and partially because I wanted them to focus on the collection of data, not specifically the design of their catapult (As it turned out, the boys found time to create three more of their own designs anyway).

I set up the catapult, starting opening up the clip on the clipboard, and right away one of the boys asked, "I wonder how far it will go?"

Fork catapult - side view

So, we collected data. What we did was open up the clip part of the clipboard so that it was 1cm, 1.5cm, 2cm, 2.5cm, and 3cm open, and shot a mini-whiteboard eraser by releasing the clip, 10 times for each position of the clip. We then measured the distance (as accurately as we could) the eraser flew across the room. The initial prediction from the boys was that the wider the clip was open, the farther the eraser would fly, which the boys continued to believe, even once we had actually collected all of the data.

I showed the boys how to plot 1 or 2 points, and then I then asked them to carefully graph the rest of the data. This is what they produced (the red dots were added later).

Graph of results

Once the boys had their data graphed (do you see the small error in the graph above?), we looked at together to see what it meant. From the graph, the boys decided that it was clear that their initial hypothesis (they didn’t use this language, I did) was incorrect and that there was a maximum distance that the eraser could be launched. One of the boys had the insight that the problem was that when the clip was "open too wide" that too much of the energy went into throwing the clip up, and not enough went into catapulting the clip forward.

The boys also reasoned that the eraser would be shot the furthest when the clip was between 2cm and 2.5cm open. Our next step was to test their new hypothesis. As you can see from the red dots graphed above, their hypothesis was probably right, although in order for the boys to see that, we first had a discussion about finding average values from the graph.

At the end of the second class, we started cleaning up, and the boys asked me to photocopy their graph and data, and let them take home their other catapult designs. One of them said to the other boys, "Let’s keep working on this next year!"

There are a lot of ways one could go with this project, but one thing I really liked about it was that we created a mathematical investigation from some pretty basic supplies, that the data that results has enough experimental error that it makes it more obvious that collecting many trials is useful, and that the graph was clear enough that students could read the results from the graph fairly easily.
 

Pay Down Debt First, or Keep Savings Intact?

My mother has offered to give us a small amount of money, which we can either use to pay down most of our debt, or we can put into a savings account, and then pay down the debt over time.

My wife and I have been debating which is the better course of action. After playing around in Excel, I decided to write a script to help us resolve this issue. See https://davidwees.com/javascript/debtsavings/

I also gave this problem (with the actual numbers my wife and I are looking at) to my 12th grade students as part of our review for their IB exams in May. One student’s reaction, "This is a real problem? Really? Wow."


*Disclaimer: The script in question is a work in progress, it may contain bugs, and should not be relied upon to do any actual financial planning.

Learning Math Through Programming

My previous article focused on using programming as an example of applying math one already knows to a different context. The purpose of this article is to describe how one could, through programming, learn a new mathematical concept.

What I will do is use some examples to show one could start with an exploration using Turtle Art (which is a programming environment designed for kids) and use this exploration to end up developing models of how a few areas of mathematics work. You can download the examples here and open them up in Turtle Art to explore them yourself.

In Turtle Art, programming is done through the use of snappable blocks, each of which represents a different programming structure. It is very similar to the Scratch programming environment, both of which are based off of the Logo programming language. Any decent exploration of Turtle Art should start with attempting to snap different blocks together and see what they do.

You could show students how to use one of the simplest blocks, the forward block. The output of this block is shown below.

Line segments are most interesting when attached to rotations, so the next block worth showing students is the rotation block. Note that as in the picture below, creating a program with these blocks means attaching them together and double-clicking on the paired blocks to see the output of your program.

Notice that, in the example below, the output is very similar as the first example, except that the turtle icon is rotated now 90 degrees relative to where it used to be.

Once students have played with rotations and moving forward, it is probably time to show them how to use the repeat function. The repeat function is one of the more powerful commands in Turtle Art as it allows any subcommands placed inside it to be replicated exactly any number of times.

Notice how you could add a square to your picture at this stage by using the same commands as before, but repeated four times. This suggests that a property of squares is that they can be generated from repeating the steps "forward n, rotate 90 degrees" four times.

At this point, students may realize that it would be convenient to start fresh each time, and so you can point out the clear block. Note that this block also resets the default starting position of your turtle.

One thing I’ve noticed students do very early on, when they explore Turtle Art programming, is change the angle of rotation. I’ve changed the angle from 90 degrees to 30 degrees in my example, and now all of the shape isn’t a square anymore.

After this, it would be natural to try and figure out how to close the shape one has drawn. Students might realize right away how many rotations they need, and they may need to experiment a bit. This experimentation, along with other related experiments that they will do, may lead them to develop a model for the number of degrees of rotation and how many repetitions of their initial forward plus rotation block they need. Below, pretending that I was a student, I only repeated the commands 8 times.

When you see your students have made this kind of discovery, it may be worth checking in with them to see if they have a model in mind for why 12 repetitions worked, and why 11 or 13 would not. In particularly, it would be interesting for them to explore, for example, what happens if they change the angle of rotation? What happens if they change how far they go forward each time?

Another thing that I have noticed students often do, once they learn about the repeat block, is stack repeats to see what happens. In this case, the extra repeats do not appear to have changed the output at all, which should hopefully lead to some questions by the student. I would recommend having the students step through the program one command at a time and see if they can understand the reason why the output is what it is.

Having understood the issue in the previous step, I decided to add a forward and a rotation into my double repetition, which leads to a fairly interesting shape which unfortunately extends beyond the edges of the view window set by the program.

At this stage, I decided to figure out how to shrink my shape. This, with some prompting, could lead to a discussion about variables. With some experimentation, students may learn that variables are an input into the program they have created which may affect the output of the program.

My first instinct after seeing the rotation above was to change the second angle of rotation to only 10 degrees to see how this influenced the output. Right away I decided that I would need to change the number of repetitions for the outside repeat loop. I would encourage any students working on an activity like this to play around with changing the number of repetitions to see if they can figure out how many repetitions will make their pattern repeat all the way around a complete revolution.

Now we really have an interesting looking shape. Notice that to get this shape, we repeated our outside loop exactly 36 times. Why 36 times, why not another number? What would happen if used a larger number?

I found the Turtle icon sitting in the middle of the other picture to be a bit distracting, so I tried to use setxy (which, by the way, students absolutely find hysterical if you mispronounce it) to move it. Notice that this particular code block would lead to a discussion about Cartesian coordinates, and that through experimentation, especially if students have an understanding of negative numbers already, lead to understanding the purpose of a coordinate system.

 I did some further exploration with the setxy tool, trying to get the Turtle icon off of my shape. Note that actually determining the actual size (in pixels) of this shape involves using trigonometry, so one could turn any exploration of shape into a mathematics problem session as well, simply by asking students to try and work out the sizes of the objects they create.

I finally got the Turtle off of the shape.

I decided that it would be nice to draw another one of these shapes in the new Turtle location, which meant I had to start changing my code to more easily allow for repetition of the code structures. Turtle Art allows for the person using it to define their own blocks. In this case, I decided to create a procedure called "Shape" which would be used to draw just the original 12 sides shape. I then called this procedure from the main block of code (see below).

I then decided to make the put the rest of the code into it’s own block as well, which I called Flower. If you look below, you’ll see that I first clean the screen, move myself into the middle of the screen, draw the flower, move to the edge of the screen, and redraw the flower shape. It occurred to me that it would be nice to change the size of the flower if necessary. Doing this would require introducing a variable.

I created a variable, which got called box1 (I wonder if I can rename this somehow). I set the value of box1, and then call the Flower procedure, and inside the Shape procedure, the value of box1 is used to determine the amount of forward movement done by the Turtle icon while it draws the Flower shape. To draw a flower of a different size, I changed the value of box1 again, and then called the Flower procedure again.


You should see that even in a relatively simple example, there are a lot of embedded mathematical concepts. Through trial and error, careful observation, and a teacher’s mentorship, students should be able to develop some models of how these mathematical ideas work, within the Turtle Art environment. Besides learning mathematics, students will also have to develop other habits, such as patience, and the willingness to trouble-shoot and debug their programs.

Applying Math in Programming

The purpose of this post is to show an example of using math in the context of programming. I’ve written the post as I created the project, to try and outline my thinking during this process as much as I can. This is an example of me applying math that I know to a different context, creating a spiral of numbers. In a future post I plan on exploring what learning new mathematics through programming could look like.

Note: This post will look much better in the online version if you are reading it in an RSS reader or your email.

First, I start with a pretty basic HTML file with some an embedded JavaScript library called jQuery, and a blank Canvas HTML element.

[html5]


Prime Spiral


[/html5]

In the Javascript file, I start with the following:


// init()
$(document).ready(function () {

});

// debugging function
function debug(message) {
$(‘#debug’).append(message + ‘
‘);
}

So far all I have done is create two template files (which I always create when I am starting a new project written in JavaScript), and I have added the minimum skeleton to both of these files to get my project started.


// settings
var settings = {};
settings.numberOfNumbers = 200;

At the beginning of the JavaScript file, I add a settings variable. This will allow me later to tweak my project settings in one central location, rather than having to find where I have an embedded setting and modify it.

Next, I decided to resize the canvas so that regardless of what browser will view the canvas, it will be visible in their browser window.


// resize the canvas to the minimum of height and width for the screen
function resizeCanvas() {

// get the new width of the canvas, which should be the minimum of the height or width of the page
settings.dimension = $(window).height() > $(window).width() ? $(window).width() : $(window).height();

// now shrink it slightly
settings.dimension = settings.dimension * 0.90;

// now resize the canvas elements
$(‘#theContainer’).css({‘height’: settings.dimension, ‘width’: settings.dimension});
$(‘#theCanvas’).css({‘height’: settings.dimension, ‘width’: settings.dimension});

}

There are two pieces of mathematics here. One is a comparison between the height of the browser window and it’s width, and the other is shrinking of the region to 90% of the original dimensions. I could have used the built in minimum value function for the first part, but for some reason, I chose not to.

The next step is to actually write the numbers in a spiral. To do this, I decided to work in polar coordinates, because spirals are convenient to draw in that coordinate system, but unfortunately browsers operate in Cartesian coordinates. Each point in the browser window can be labelled with an x, y position, as measured from the bottom-left corner of the canvas. My objective is to start numbering the spiral from the center of the canvas, so I will have to translate each point, after having converted from polar coordinates to rectangular coordinates.

Here is the function for the conversion:


// convert from polar coordinates to offset cartesian coordinates
function convertFromPolarToCartesian(radius, theta) {

// A point at (radius, theta) can also be thought of as being
// at the end of the hypotenuse of a right-angled triangle,
// hence we can use trigonometry to find the Cartesian coordinates.
// Note: theta will need to be in radians to be useful here, since
// the Math.cos() and Math.sin() functions assume the angle is in radians.
var x = Math.cos(theta)*radius;
var y = Math.sin(theta)*radius;

// now shift the point into the center of the canvas
x = x + settings.dimensions/2;
y = y + settings.dimensions/2;

// return both points as an array
return new Array(x, y);
}

Now comes a moment of truth. I have not yet been able to test these most recent functions I have created, so they may have mistakes in them. I need to actually attempt to use these functions to find out if they return the expected values. My next step is to therefore try and produce a function which will create the spiral of numbers, using the functions I have so far as tools. First, I want to cycle through all of the numbers, which looks like this:


// draw the spiral of numbers
function drawNumbers() {

// cycle through each number from 1 to the maximum number of numbers given
for (var index = 1; index <= settings.numberOfNumbers; index++) { } }

This is essentially a sequence of numbers where I start with a value of 1, and I increase them (using index++), until I reach the maximum value as set globally in the script.

With each of these numbers, I am now going to want to calculate what it’s position would be, remembering that I’m going to work in polar coordinates. I want the radius of the position of the numbers to slowly increase in a linear way, from an initial value of zero, to a maximum value of just less than half of the maximum width of the canvas. Therefore when the number is 1, this should map to a radius of zero, and my maximum number should map to my maximum radius. Here’s my initial guess as to what this conversion should be:


radius = (index – 1) / settings.numberOfNumbers * (settings.dimension / 2) * 0.90;

For the angle, I just want it to increase at a constant rate for each number, remembering that I will be working in radians. An increase in angle of $\frac{1}{32}$ of a full rotation of a circle seems like a reasonable initial guess.


theta = (index – 1) * (1 / 32) * Math.PI;

Next, I used the function I created earlier to convert into Cartesian coordinates (with the shift), and finally I created a function which should actually display the numbers on the canvas. Here is what the full spiral function looks like at this stage:


// draw the spiral of numbers
function drawNumbers() {

// define the variables
var radius, theta, coordinates;

// cycle through each number from 1 to the maximum number of numbers given
for (var index = 1; index <= settings.numberOfNumbers; index++) { // set the radius so that it increases as the index increases, but is initially zero // note that we also want to scale the radius down slightly so that our spiral // is slightly smaller than the canvas radius = (index - 1) / settings.numberOfNumbers * (settings.dimension / 2) * 0.90; // our angle should increase at a constant rate, starting at 0 theta = (index - 1) * (1 / 32) * Math.PI; // now convert these into Cartesian coordinates coordinates = convertFromPolarToCartesian(radius, theta); // and then actually draw this number drawNumber(index, coordinates.x, coordinates.y); } }

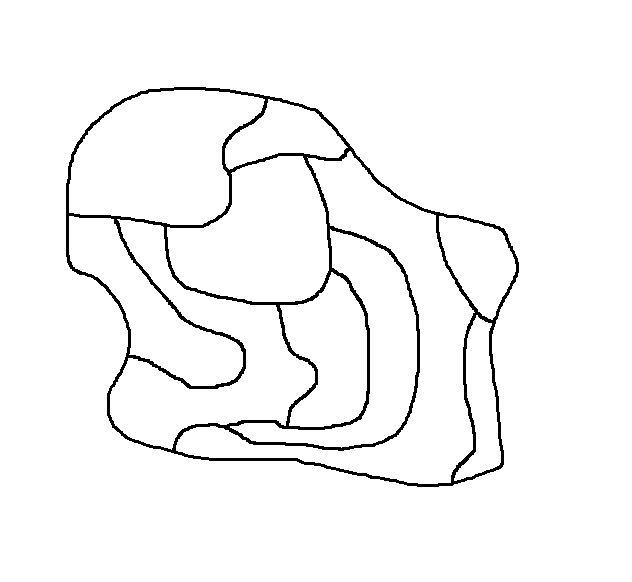
Here’s the output of this function.

Ooops! Something went wrong. I scanned through my code, and luckily I spotted my mistake quickly. I had included an extra “s” in my polar coordinates to Cartesian coordinates conversion function. Here’s the updated output. This process of debugging a mistake can sometimes be quite frustrating, so it requires developing patience.

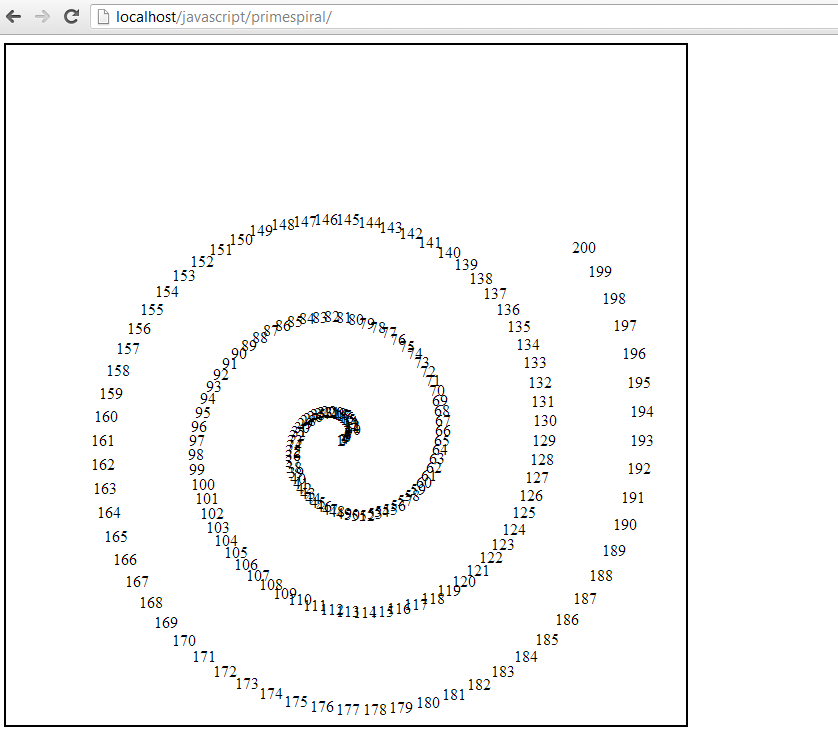
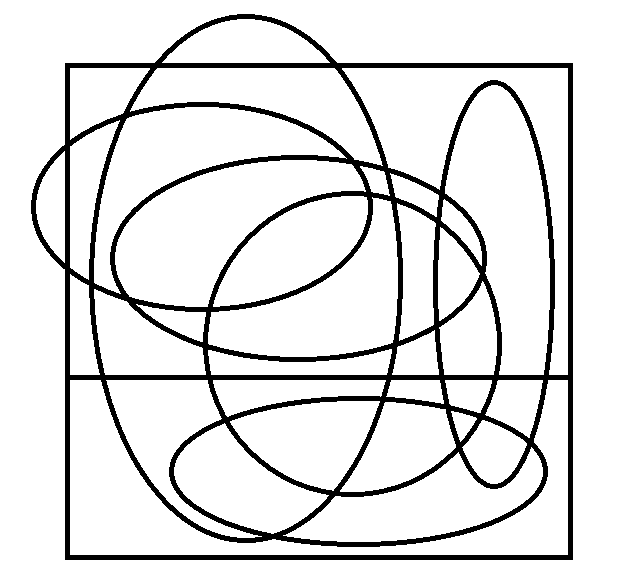
It is clear that my basic concept works at this stage. The numbers look very tightly jumbled at the beginning, which is probably because the angle rotation isn’t sufficient early on. My assumption that a linear increase in angle would work is probably wrong. Also, the spiral isn’t centred inside the canvas, suggesting that I will want to work on my conversion function.

I want the angles to start spread out more than they are, and then slowly increase over time. I tried some of the following, none of which produced the desired effect.


// tried varying the fraction increase of the angle
theta = (index – 1) * (1 / 16) * Math.PI;

// tried using a reciprocal function for the angle
theta = (index – 1) * (10 / index) * Math.PI;

// tried using a reciprocal square root function for the angle
theta = (index – 1) * (10 / Math.sqrt(index)) * Math.PI;

// trying a decay function on the angle
theta = (index – 1) * (Math.exp(-1*index/100)) * Math.PI;

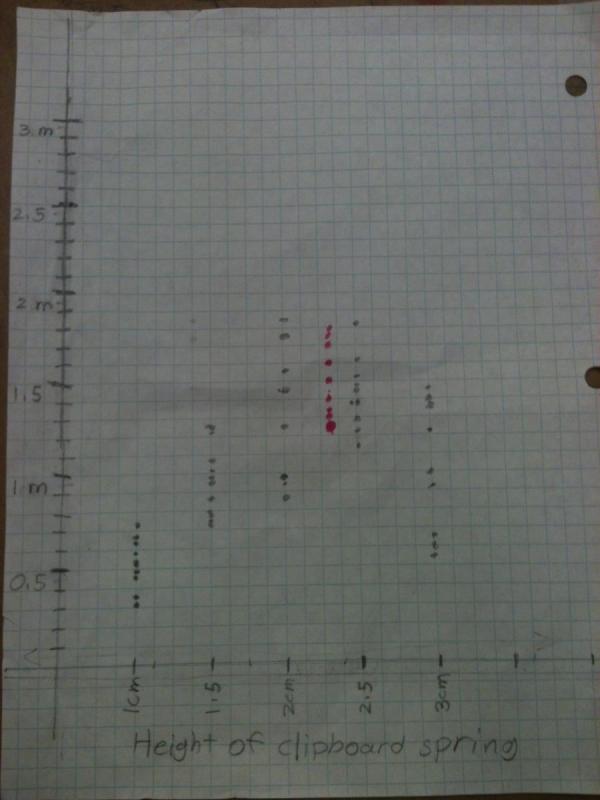
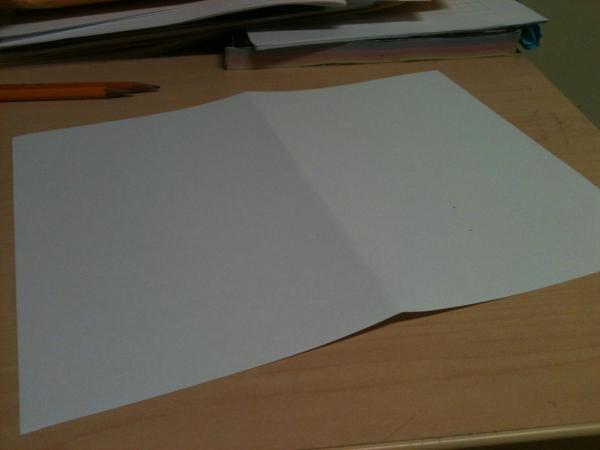
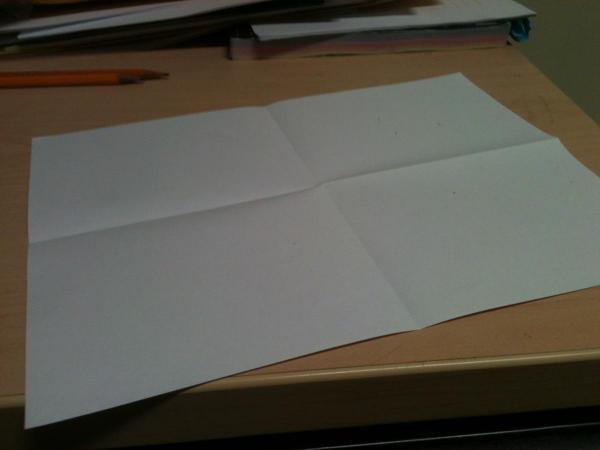
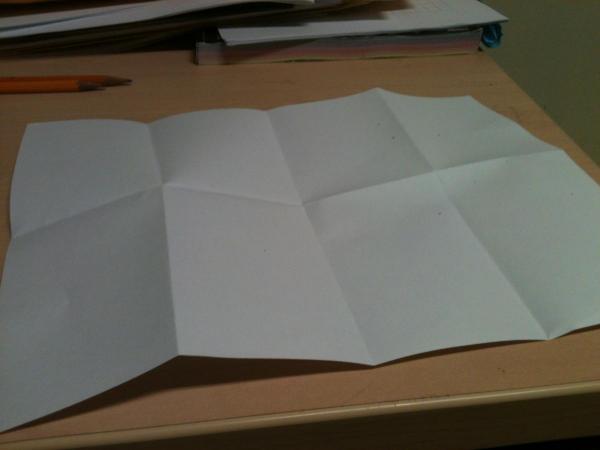
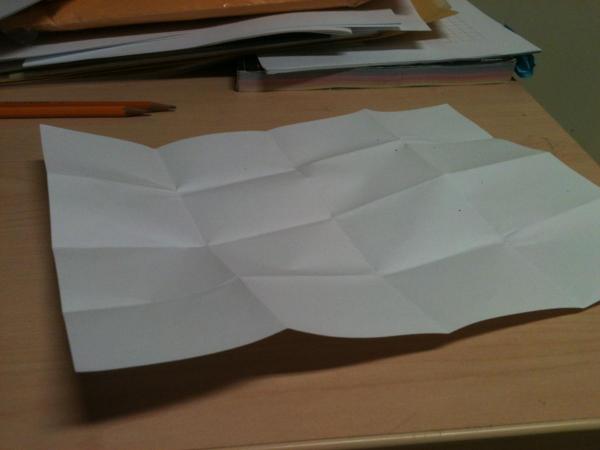
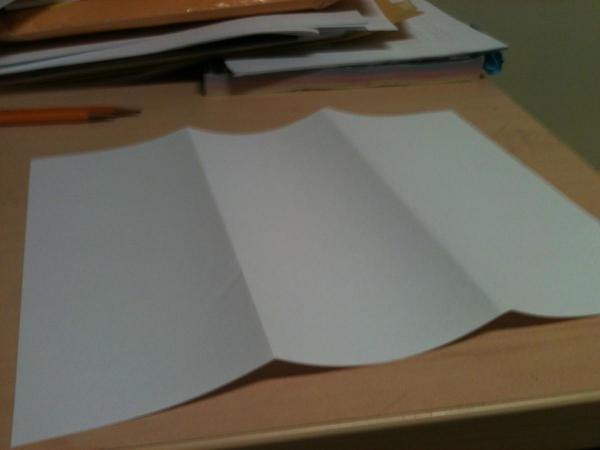
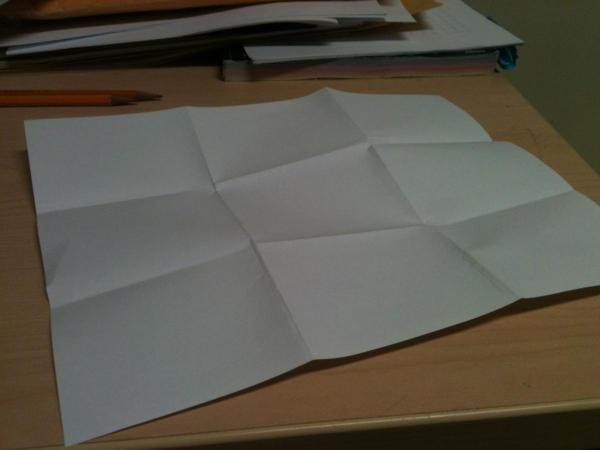
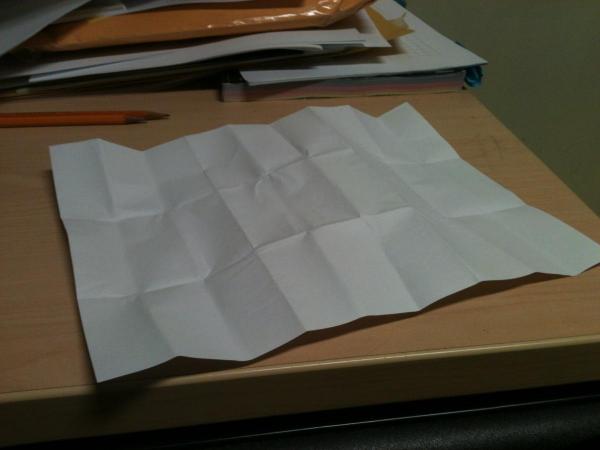
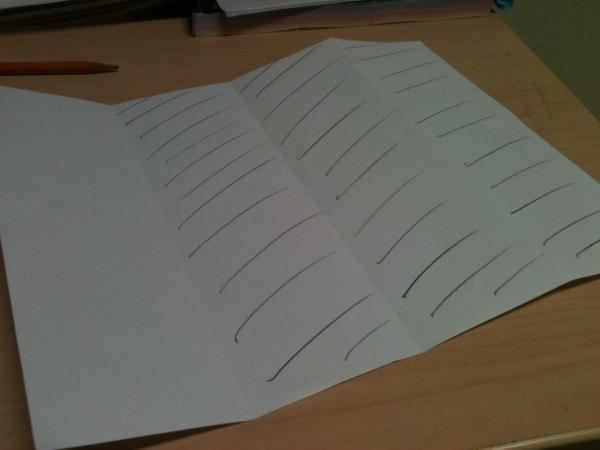
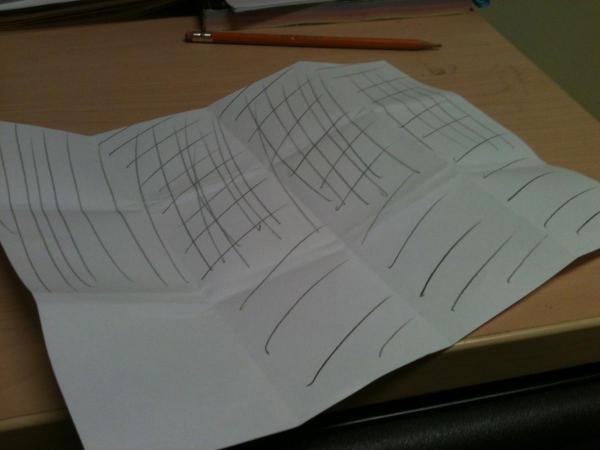
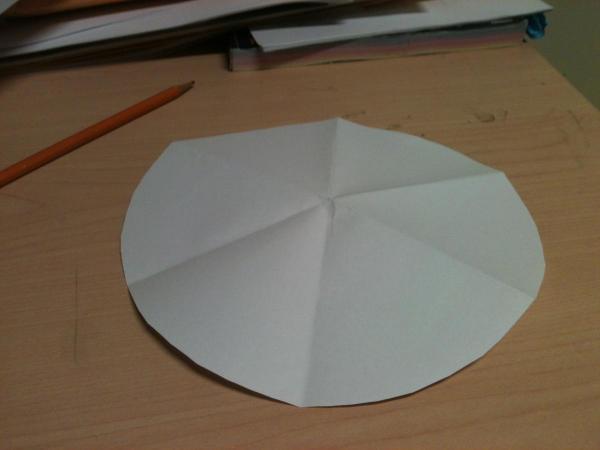
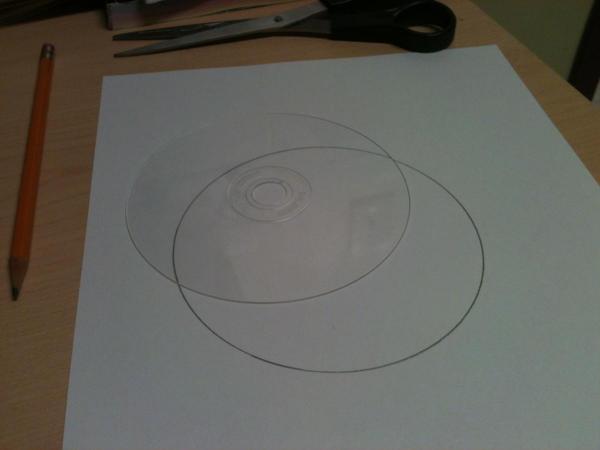
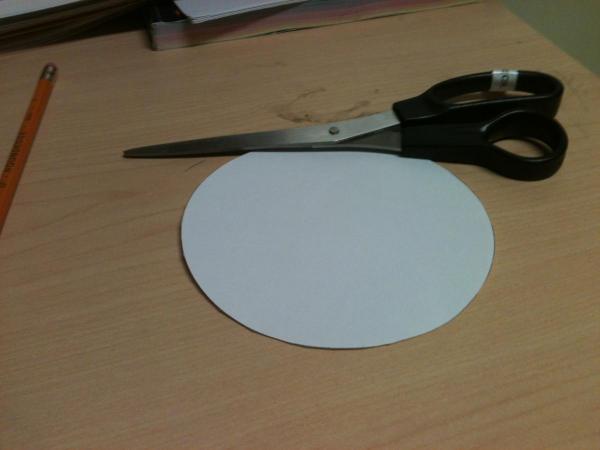
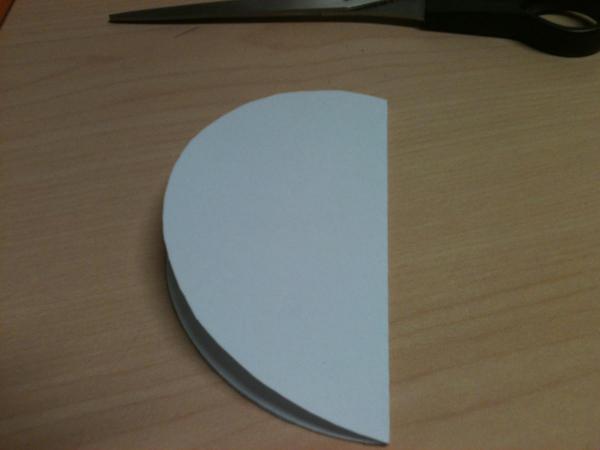
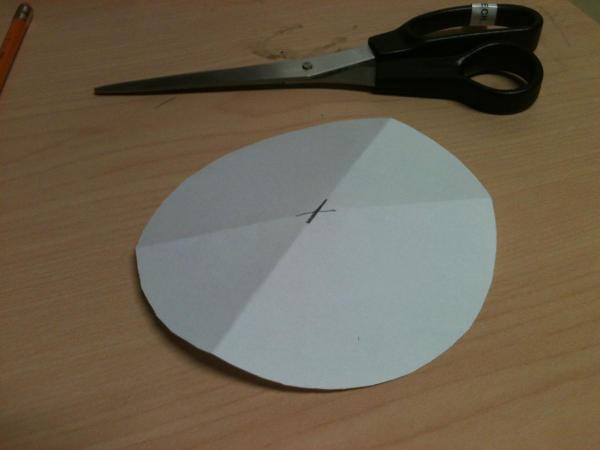
I realized at this stage that what I wanted was not a constant increase in the angle, but a constant distance between the points, after their conversion into Cartesian coordinates. I decided to try and draw this out on paper to see if I could work out an algebraic relationship. I decided then to draw the following diagram to see if it would give me any insights on how to proceed:

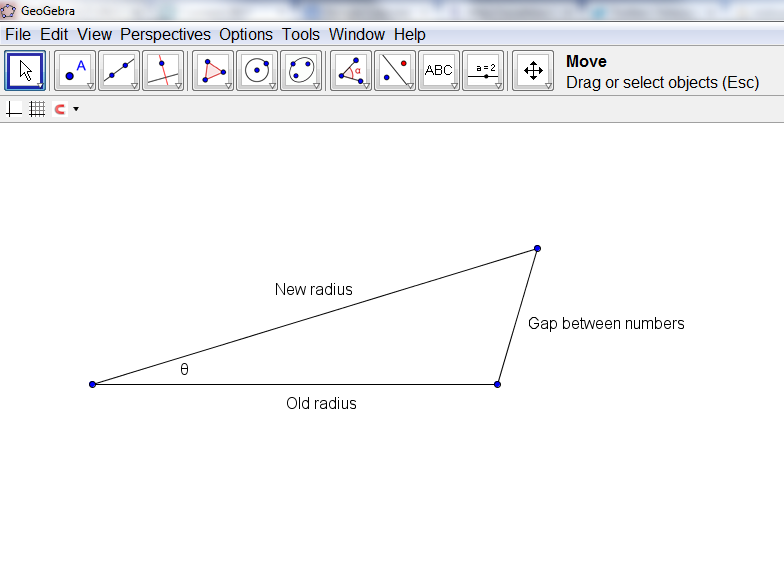
When I looked at this, I realized that I could use the Cosine law to find the angle, given the new radius, old radius, and the gap between the letters. Initially, I tried a constant gap between the numbers, but after some playing around, I decided to gradually increase the font size between the numbers, and at the same time, gradually increase the gap between the letters. I ended up settling down on this as my final set of formulas for determining the position of the numbers.


// draw the spiral of numbers
function drawNumbers() {

// define the variables
var radius, radiusnew, rhs, theta, coordinates, fontSize;

// cycle through each number from 1 to the maximum number of numbers given
for (var index = 1; index <= primespiral.settings.numberOfNumbers; index++) { // set the radius so that it increases as the index increases, but is initially zero // note that we also want to scale the radius down slightly so that our spiral // is slightly smaller than the canvas radius = (index - 1) / primespiral.settings.numberOfNumbers * (primespiral.settings.dimension / 2) * 0.90 + 10; // keep track of the old radius radiusnew = (index) / primespiral.settings.numberOfNumbers * (primespiral.settings.dimension / 2) * 0.90 + 10; // fontsize should increase linearly as the index does fontSize = Math.round((index) / primespiral.settings.numberOfNumbers * 10 + 10); // calculate the rhs of the cosine law rhs = (radius*radius + radiusnew*radiusnew - (fontSize*1.5)*(fontSize*1.5))/(2*radius*radiusnew); // ensure that there is a minimum radius if (rhs < 0) { rhs = 0.1; } // our angle should increase such that the distance between the numbers is kept constant; theta = Math.acos(rhs); // now convert these into Cartesian coordinates coordinates = convertFromPolarToCartesian(radius, primespiral.currentAngle); // increment the next angle primespiral.currentAngle += theta; // and then actually draw this number drawNumber(index, coordinates.x, coordinates.y, fontSize); } }

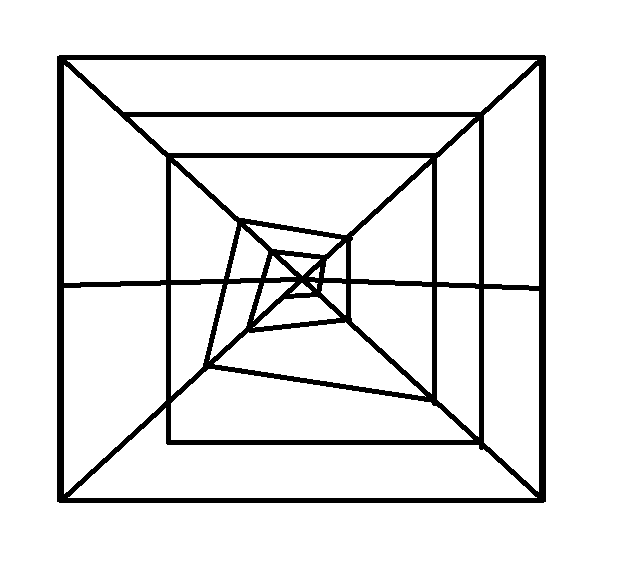
How this works is that it calculates the current radius, the radius of where the next number will be placed, and then calculates the angle that corresponds to the gap between the letters, and then it saves all of this information for the next iteration of the loop by incrementing the current angle variable. I also worked on the portion of my script that converts the polar coordinates into Cartesian coordinates in an effort to better centre the spiral. This is my output with this code:

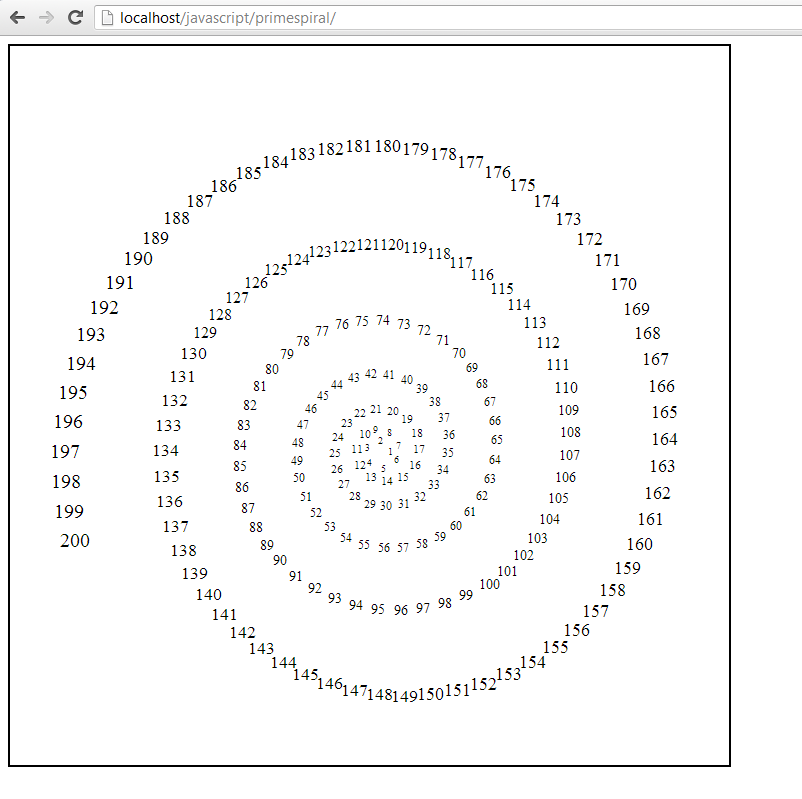
I decided, somewhat arbitrarily, that the next step is to identify which of the numbers are prime, and highlight them in some way to make them distinct. This means that I needed to write a function to determine if a given number is prime, and then pass along this information to the function that draws the numbers. Here was what I ended up with. Note that this function actually doesn’t work completely (except for “small” numbers) as noted in the comment at the end.


// identifies if a given number is prime or not
function isPrime(number) {
// naive algorithm
var primes = new Array(
2,3,5,7,11,13,17,19,23,29,
31,37,41,43,47,53,59,61,67,71,
73,79,83,89,97,101,103,107,109,113,
127,131,137,139,149,151,157,163,167,173,
179,181,191,193,197,199,211,223,227,229,
233,239,241,251,257,263,269,271,277,281,
283,293,307,311,313,317,331,337,347,349,
353,359,367,373,379,383,389,397,401,409,
419,421,431,433,439,443,449,457,461,463,
467,479,487,491,499,503,509,521,523,541,
547,557,563,569,571,577,587,593,599,601,
607,613,617,619,631,641,643,647,653,659,
661,673,677,683,691,701,709,719,727,733,
739,743,751,757,761,769,773,787,797,809,
811,821,823,827,829,839,853,857,859,863,
877,881,883,887,907,911,919,929,937,941,
947,953,967,971,977,983,991,997,1009,1013);

// check to see if the number is 1
if (number == 1) {
return false;
}

// first check to see if our potential prime is in the list
for (var i = 0; i < primes.length; i++) { if (primes[i] == number) { return true; } } // now check every prime smaller than n for (i = primes.length - 1; i > 0; i–) {
if (number % primes[i] == 0) {
return false;
}
}

// this isn’t actually guaranteed, unless n < 1013*1013 return true; }

Putting all of this together, and I end up with this. You can view the entire JavaScript file here.

What mathematics did I end up using? Do you think that this kind of application of mathematics would be a valuable one for students to experience?

I’m moving to NYC


Back in November I talked to my head of school to let him know that I was seeking leadership opportunities. I love my school, it is a fabulous place to work, and one of the things I love about it the most is that everyone has some shared responsibility for leadership in different areas of the school. We have two directors, one for the Junior School division, and one for the Senior School division, both of whom I admire and respect very much, and we have many people with minor leadership roles, essentially creating a somewhat flat hierarchy. One of the problems with this hierarchy though is that I have no way to gain enough experiences at my school to learn enough to be to able to take on the role of a Director position. In my conversation with my head of school, we realized this, and realized that I would probably need to look at moving onto a new school or other role if I wanted a greater leadership role.

I sent off an email to my best friends around the world and asked their advice. Most of them responded, and after doing some independent job search through the various international schools around the world, I ended up with eight different job offers to explore, all of which entailed more of a leadership role than I currently have.

The most exciting of these opportunities came through my friend Andrew Stillman who works for New Visions for Public Schools in NYC. Andrew connected me to Janet Price, Director of Instruction for New Visions, who decided (after reviewing my resume and interviewing me with a team of others) to offer me a job as a Math Formative Assessment Specialist for New Visions, which I accepted. I start at the beginning of July.

My core duties at New Visions will be:

  • Collaborate with MASTER program staff and faculty at Hunter College to design and implement new curriculum and assessments for MASTER residents focused around the development of pedagogical content knowledge in math.
  • Collaborate with New Visions and Hunter College faculty on in-field coaching and assessment of mentors and residents. Work with the team to set standards, review candidates’ progress, and iteratively adjust the program design
  • Curate tasks that support embedded formative assessment strategies and develop teacher training for effective teacher use of these tasks to support learning through units of algebra and geometry in the common a2i curriculum
  • Meet weekly with school-based teams in  two  New Visions high schools to, through a collaborative inquiry process:
    • Implement a common-core aligned curriculum in algebra and geometry
  • Facilitate looking at student work on formative assessment tools, including pre-unit, post-unit and day-to-day units to continuously improve curriculum , inform future lessons and identify areas for re-engaging students in content and processes
  • Facilitate the development of teachers’ pedagogical content knowledge and instructional strategy “toolboxes” through:
    • Assisting  teachers in developing their listening,  questioning and feedback skills and their ability to engineer effective classroom tasks
    • Leading the math teacher teams in an inquiry process within and across schools to continuously use information gleaned from student work to improve instruction and meet student needs
  • Meet regularly with math coaches to, through a collaborative inquiry process, reflect on the teachers’ progress as evidenced by student work and revise and plan new interventions and supports to move teachers forward.
  • Assist in planning and facilitating of cross-school inquiry.
  • Build and sustain relationships with schools and principals and support capacity building in participating schools.
  • Engage in 5 hours per week in peer-to-peer learning and support on a team of Instructional Specialists and Residency Coaches

I’m looking forward to this role, while at the same time feeling sad about leaving my current role, my colleagues, my students, and Vancouver (a city I have grown to love, despite its rain). Change is always uncomfortable, although this is somewhat easier for my wife and I, given that this will be the fourth different country we’ve moved to together. Also, I started my teaching career in NYC, and lived for three years, so I am fairly familiar with the city.

I’m going to miss British Columbia, but I have no intention of severing my connection to it. This role in NYC will not last forever, and I hope to keep intact my ties here in British Columbia for when my wife and I decide that we miss Vancouver and our friends too much, and want to return home.

Those of you who have been following my work for a while will know that I am passionate about two main areas in education, mathematics education and the application of technology to education. This role will help me pursue my passion for improving mathematics education, and knowing me, I will almost certainly bring in technology to whatever role I do.

Math in music

I’m always on the look-out for ways of finding connections between mathematics and other areas of knowledge. Music is one of the areas of knowledge that I know has some similarities with mathematics, and so I’ve been brainstorming ways one could incorporate music into a mathematics classroom. Here are a few examples.

  1. A musical scale is an example of a sequence (of notes) and could be used to show the idea the order of objects, related to the order of numbers. As each note in an ascending scale is played in sequence, students should be able to hear that the notes have a order, and then you can relate this order to the order we associate with the counting numbers.


  2. Introducing students to patterns can also be done nicely with music, either with notes, or with percussion instruments. Here are two sample patterns. One simple activity to do with students here is to have them produce their own different types of patterns.


  3. You can also use music to develop some conceptual understanding of skip counting. Often children are taught to count by 2s and 3s but do not necessarily understand what this means. Obviously one should use manipulatives and other techniques to develop this understanding, but here’s an example of how skip counting sounds in music. This example could also be used as an introduction to simple linear functions as well at a later grade.


  4. You could introduce students to fractions by comparing relative sizes of different notes. In the example below, the music starts off with 16th notes, followed by 8th notes, quarter notes, half notes, and finally a whole note. Can you hear how obvious the difference is between the notes?


  5. Music notes themselves are sound waves, which if you have an oscilloscope, you can visualize directly as you listen to a note. A pure note has a relatively simple associated wave, but notes as played on a music instrument are almost always composed of multiple harmonics (or waves of different frequences added together). This is an example of a capture from a digital oscilloscope. What do you think the seemingly random waves that appear between the notes are from?

    You can also visualize the volume of the notes (by opening up an audio recording of some music being played in a program like Audacity, for example), and notice an interesting drop-off that occurs. If you measure this drop-off closely, it should match an exponential decay function.

    Notice also what the volume of the notes over time looks like when we zoom in on one of them.

    Interesting periodic function


  6. Imagine you played one note on the piano at one constant speed, and another note at a different constant speed. After how many notes would you play both notes at the same time? This is an application of the lowest common multiple (provided you express the number of notes played per unit time in lowest terms). Below is a video where one note is being played at a rate of 120 times per minute, and in a different recording, the same note is being played at a rate of 150 times per minute. Do you notice something interesting when both recordings are played simultaneously?


  7. Another area where mathematics comes into play is in the ratio of the wavelengths of different notes. Karen Cheng does an excellent job of explaining how this relates to why we appreciate some music more than other music.


Hopefully these short examples give you some examples of how mathematics and music are related. In another post, I intend to look at musical instruments, and how mathematics can be used to construct them.


* Musical scores created with Noteflight. This program has a free demo one can use without signing in, but if you want to save your work, you will need to sign up for a free account.

** If you are viewing this post in your email, none of the videos will be visible, so I recommend reading it online here.

Colouring problems

I’m currently working on math enrichment activities with some 3rd and 4th grade students. Aside from using some standard resources for enrichment, I’m finding that I can find challenging problems from different areas of mathematics and find ways to introduce the main concept to students in a context they understand.

For example, our current question is, what is the minimum number of colours required to colour a map? The solution to this is well-known, but not in the circles 3rd and 4th graders hang out in. Here are some sample maps if you want to explore this on your own, or with your students (but I would recommend using real maps, at least to begin with, and then having students generate their own maps).

Here are some sample puzzles to get you (or your class) started. For each of the following maps, find the minimum number of colours to colour in the map so that no two adjacent sides are the same colour (countries which share a single point/vertex are not considered to be adjacent, only if they share an edge).


Puzzle 1

Puzzle 2

Puzzle 3

Paper folding activities

I’ve been playing with paper folding recently, and exploring the mathematics involved. I’m simply amazed by the number of mathematical ideas that can be represented by paper folding, so I thought I would share a few of my discoveries here.

Sequences

Folded in half

Paper folded in quarters

Paper folded into eighths

Paper folded into sixteenths

As you can see above, you can generate the sequence of numbers 1, 2, 4, 8, 16, 32 and so on, just by folding the paper in half again each time. This means that there is an exponential relationship between the number of folds you have made and the number of areas created on the paper.


Paper folded into thirds

Paper folded into ninths

Paper folded into 27ths

Notice that if I instead fold the paper into thirds each time, the sequence changes into 1, 3, 9, 27, etc… which suggests that folding a piece of paper is a little bit like multiplication.


Fractions

three quarters

First, form the fraction 3/4 by folding the paper into quarters and shading three of them in.

two thirds time three quarters

Now fold the paper in the other direction into thirds, and shade 2/3, ideally in the other direction. Where your two shadings have overlapped is the product of your two fractions, in this case 6/12.


Symmetry

Paper folded into circular sixths

Paper folded into sixths, with cut-outs

Here is an example of folding the paper around the centre to produce rotational symmetry. I worked with a student to produce snowflakes with  9 points, 12 points, and other points, after watching this interesting video by Vi Hart


Tessellations 

Tessellation folded up

Tessellation unfolded

If you fold a paper in half a bunch of times, you can create a tesselation by cutting portions of the paper out. The number of folds and the size of the repeated portion of the tessellation have an interesting relationship.


Circle geometry

Circle cut out

Circle cut out

Circle folded in half once

Circle folded in half in any other direction

If you very carefully cut a circle out of a piece of paper (which will finally give you a use for all of those CDs you have laying around you aren’t using anymore), you can prove quite a large number of the theorems from circle geometry by folding the paper in certain ways.

For example, if you fold the paper in half twice in two different directions, the intersection of the folds has a useful property.


For further resources on paper folding and mathematics, see this TED talk by Robert Lang, this book on the mathematics of paper-folding, and this useful PDF describing some geometry theorems that can be demonstrated through paper folding. See also this very interesting article on fraction flags (via @DwyerTeacher).