When I first started planning lessons, each lesson took ages to plan. I don’t really remember exactly what I wrote except that usually the lessons were based on choosing example problems to go over, producing a worksheet for students to work on, and assigning homework questions. Eventually I finally had some textbooks for students and so these lessons ended up being reduced to references to page numbers and questions in those textbooks.
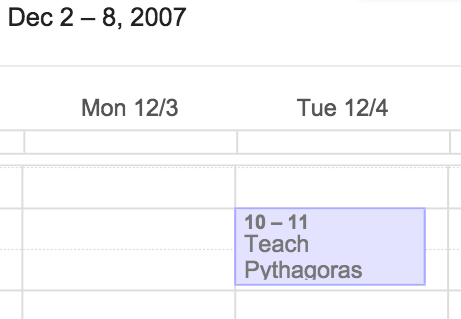
A sample lesson plan
At some point I decided that being very economical with my planning was the mark of good teaching and so my lesson “plans” ended up being really short. “Teach Pythagoras” was an actual lesson plan I wrote. Of course, “Teach Pythagoras” is not a lesson plan. It’s not even really a topic. It’s a short-hand for pick some examples, tell kids how to solve those examples in an ad hoc fashion, followed by make up some examples for kids to try and solve themselves.
A sample project
When I started using longer-term projects, that meant planning lessons got even easier as I could assign a time-line to the completion of the project and in each day I would support students either with some examples for the whole class to move their work in the project forward or by circulating through the class to help students out.
Up until this stage, any student mathematical discussions that occurred were ad hoc and almost always initiated by students. Not once in my classroom teaching experiences did I plan for student discussion.
About three years ago, I started a new job as a formative assessment specialist. It was then that I first read Peg Smith’s Thinking Through a Lesson protocol. As I read the article, I realized right then that I had spent most of my career planning poorly.
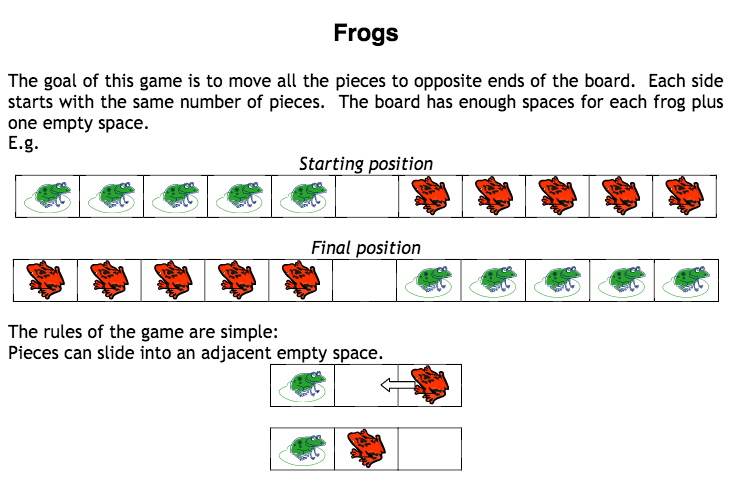
Next I read Dan Willingham’s book on Why Don’t Students Like School? and realized that I had spent most of my career planning tasks for students to do and not planning the thinking I wanted students to do. Tasks prompt thinking but what thinking? Here’s an example of a lesson that could have been one my early lessons. What are children being asked to think about?
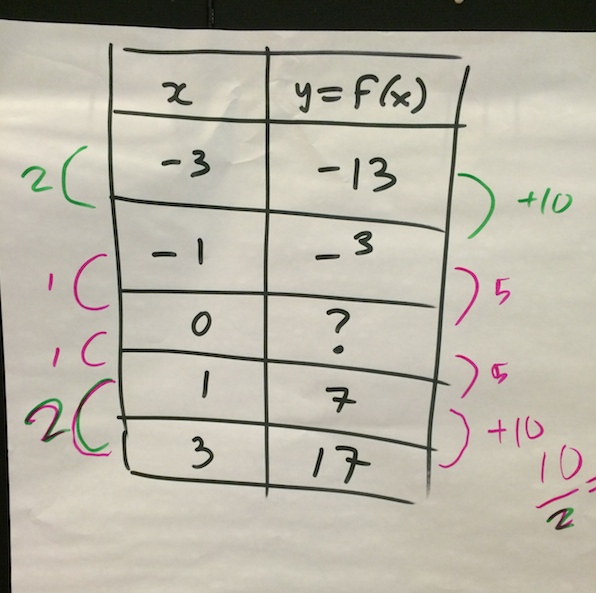
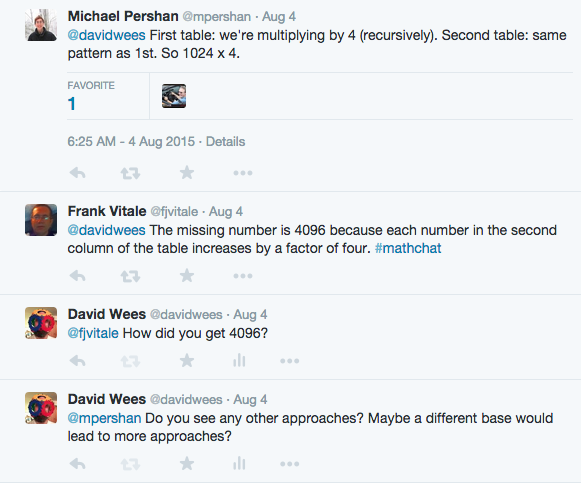
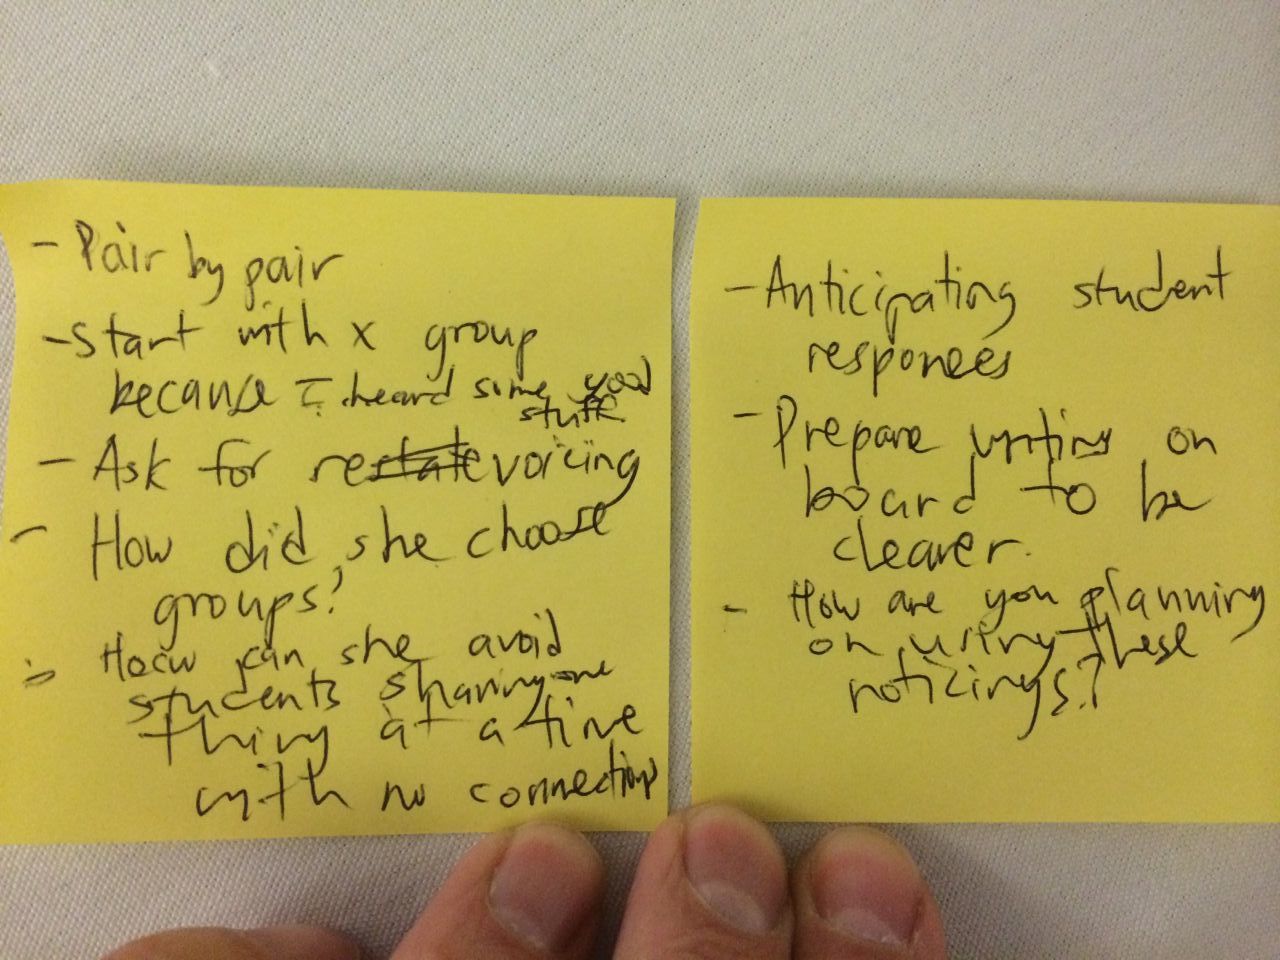
A sample anticipation of student ideas
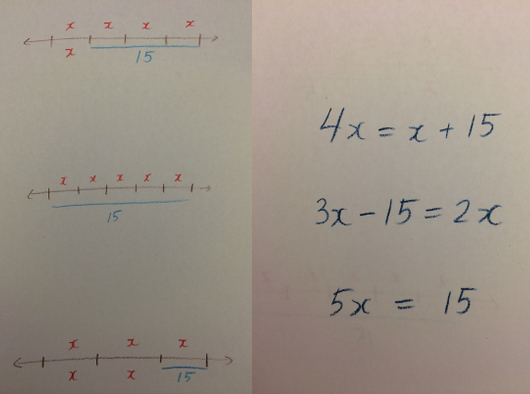
Fortunately, I had an opportunity to test out these new ideas around planning for myself. I started teaching my son and between 6 and 8 other kids close to his age in a Saturday class. I decided to plan the student thinking, to try out the Thinking Through a Lesson Protocol, and most importantly, to ask other people to comment on my plans. Here’s my first lesson plan for this class. It’s by no means perfect but it has far more detail on what I will do in response to what I expect students to do, and the first example I can recall of a lesson where I explicitly planned a whole group discussion.
But who has time to plan lessons at this level of detail five days a week, potentially 4 or 5 times each day? The level of planning linked above is unsustainable for classroom teachers.
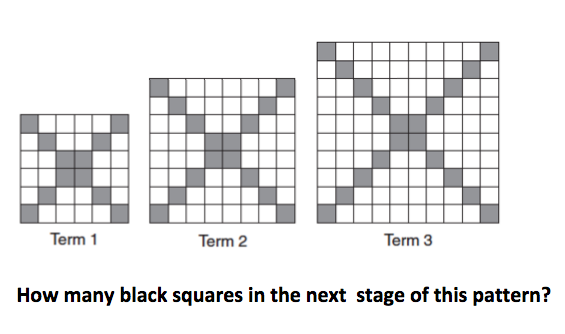
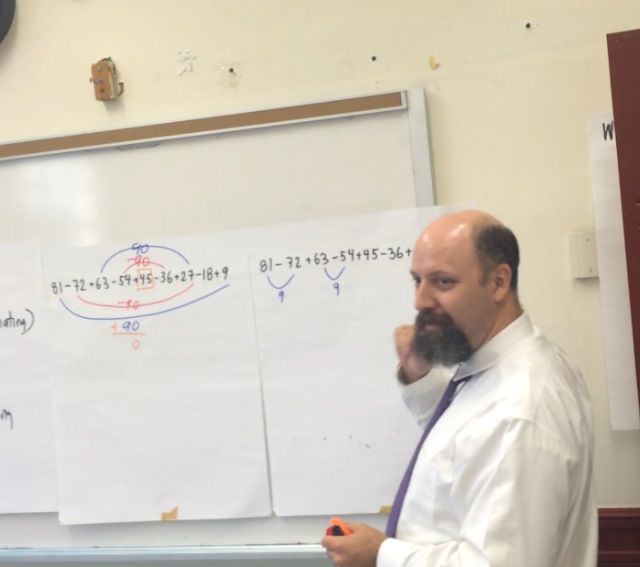
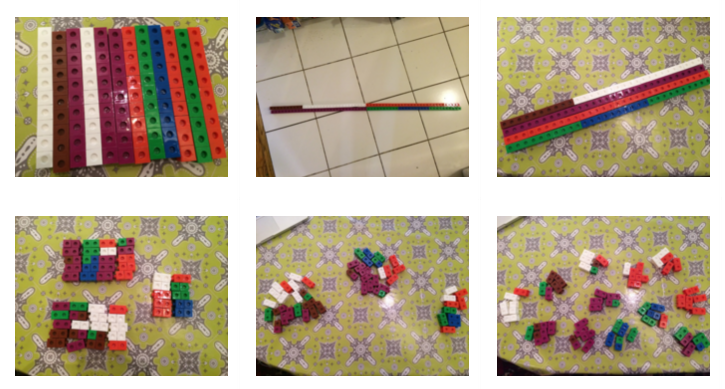
A sample task for Contemplate then Calculate
Last summer we started introducing instructional activities to teachers across our project. Instructional activities, as defined by Magdalene Lampert and Filippo Graziani, are “designs for interaction that organize classroom instruction”. Essentially they define a set of moves a teacher makes to position students to talk to each other about mathematical ideas, surface student thinking about those mathematical ideas, and then orchestrate a classroom discussion around the ideas in order to focus students on a mathematical goal.
These instructional activities have the advantage of bounding the scope of decisions a teacher can potentially make when planning a lesson while focusing the decisions that are made ahead of the lesson on planning for the thinking students will do, and then in the lesson enactment, allowing teachers and students the space to think about and respond to each others’ thinking. The routineness of an instructional activity, if the same structure is used many times, allows thinking about roles, what’s coming up next, to fade into the background so that more thinking can be focused on the mathematical ideas.
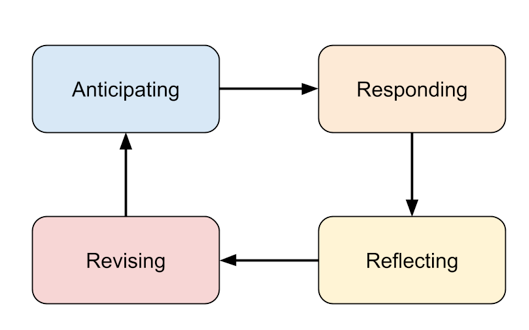
When planning one of these instructional activities, I find myself choosing an appropriate task based on some understanding of anticipated student thinking, then imagining how students might approach the task and what they will think about, then considering how to sequence the different strategies student might use toward a big mathematical idea, and then creating the resources to enable me to use the instructional activity in the classroom. This level of planning is sustainable.
As I reflect on my own development of planning over the course of my career, it seems to me that I would have benefited from knowing about planning routines that other people use. I would have benefited from learning at least a few instructional activities so that I didn’t need to plan every aspect of my teaching. I would have benefited from access to tasks where student thinking was anticipated for me. I don’t think a highly scripted curriculum would have developed me as a professional (but maybe my students would have benefited). I would have benefited from seeing how other people sequenced mathematical ideas.
In short, I would have benefited from more explicit teaching of how to plan lessons.