Education ∪ Math ∪ Technology

Year: 2011 (page 3 of 28)

Computer based math – hand or machine? DRAFT

I’m to be on a panel for the Computer Based Math summit happening in a couple of weeks, and I have to construct a 5 to 10 minute presentation on the following question:

Where do we draw the line between what should be done "by hand" and what calculations can be done on a computer in mathematics education?

If you could help me with some feedback (and potential challenges) on my position (see below) that would be helpful. I’d like to thank the various people who have influenced what I’ve written so far as well.
 

My existing posts on this topic:

https://davidwees.com/content/mumbo-jumbo
https://davidwees.com/content/computers-should-transform-mathematics-education
https://davidwees.com/content/conrad-wolfram-teaching-kids-real-math-computers
https://davidwees.com/content/when-should-we-introduce-kids-programming
https://davidwees.com/content/maybe-we-should-be-aiming-computer-programming-instead-calculus-math


Summary:

Conceptual knowledge is necessary to be successful at mathematics, but I believe that for many of the algorithms we teach students, there is little difference between using a computer to do the algorithm and using pencil and paper. Some of the algorithms themselves have embedded conceptual knowledge, and are of course important to learn, but should be learned for understanding how the algorithm itself works, rather than necessarily memorizing the algorithm.
 

Bio:

David is a mathematics teacher and learning specialist for technology at Stratford Hall, a small independent school in Vancouver, BC. He is an experienced international educator, having worked in the USA, England, Thailand, and Canada. He has his Masters of Educational Technology from UBC, and Bachelor degrees in Mathematics, and Secondary School Education. He has written numerous articles for magazines, and blogs regularly at https://davidwees.com


Position:

I want to challenge the broad assumption that seems to exist, at least in k to 12 education, that there is a best set of content for learning mathematics. Aside from some numeracy skills, and arithmetic, the vast majority of the mathematics we learn tends to focus on algebraic (and eventually calculus) thinking. I suggest that what would be better would be to focus on mathematical thinking, and to allow much more room for many different kinds of math to creep into our schools. Learning algebra, for a dedicated individual interested in using it in a science, math, or engineering career, is not that difficult and would only take a year. Instead of the issue being hand versus computer, we could focus on ensuring that students learn how to think mathematically, in a variety of different ways.

Specifically related to calculating using a by-hand method or a computer, both are mechanical operations; without understand the algorithm, one cannot really be considered to be doing math.

Paper, pencil, and language itself, are all forms of technology. If the technology changes, the way the algorithm is done changes. When we use a computer to do a calculation rather than doing it by hand, we are merely trading one algorithm which students could potentially understand or not understand for a different one.

Critically, pushing around symbols on paper is just a symbolic representation of the real math taking place within one’s head. When one does a calculation, whether it is by hand, or by machine, an important feature of whether or not one can be said to be doing the calculation is whether or not one can predict the potential output from the algorithm, or if one understands the process they are using. By prediction, I mean, have the ability to recognize nonsensical answers, and to have a feel as to the approximate size of your answer at least, if not always the exact value.

It is important to recognize that this is not a new perspective. Consider this statement from the Agenda for Action produced by the NCTM in the 1980s.

"It is recognized that a significant portion of instruction in the early grades must be devoted to the direct acquisition of number concepts and skills without the use of calculators. However, when the burden of lengthy computations outweighs the educational contribution of the process, the calculator should become readily available."

Obviously we can easily substitute calculator for computer. So the NCTM draws the line between that which is educationally useful versus a “burdensome” calculation. Clearly this is a fuzzy line and needs clarification, which is part of the purpose of this discussion.

Control over what one does is a key aspect of “doing something” and is often the chief complaint against using a computer to do mathematics. “If you just enter it into the machine, you aren’t doing mathematics, the machine is doing it for you.” A story might be useful here, so you can understand my perspective on this.

One of my friends is an oceanographer, and at the end of the summer, he and I had a conversation at a party about what he does for a living. I asked him if he does any math as part of his job, since I am, of course, naturally interested in where mathematics is used outside of school. He replied, “No. My computer does all of the math for me.”

He explained to me that he spends about half of his time creating mathematical models to describe ocean currents and climate on a small scale, and then uses the computer to crunch data and compare it to his model. For example, he recently proved that of three data collecting stations a company he is working for deploys, one of them is unnecessary since the other two can predict the conditions at the 3rd station with 88% accuracy.

So here is this person who is creating complex models involving differential equations, writing Matlab scripts to crunch data, and comparing the output of the scripts to his models, and then communicating his analysis to his employer, and he doesn’t consider himself to be doing mathematics because the calculation step is done by his computer.

I think we probably agree that my friend has done a great deal of mathematics, and that what he does for a living models some of the mathematics we’d like our students to be able to do. His creation of a model, programming of that model into his computer, analysis and organization of the resulting data afterward is all highly mathematical, and is the kind of stuff that we could consider to be done “by hand.”

What I also see from this story is that my friend is most definitely “in control” of what he is doing. He has both control over the process he is following, and over the machine which is helping with calculations he could not possibly do “by hand.”

Further, when you program the machine, you are in control of what it does. If you make a mistake in your program, the computer complains.

So we require then an ability to predict and understand an algorithm, an ability to use it to model contextual situations, and an ability to use the output of an algorithm to reason and communicate mathematics. We also require, as a system, much more flexibility in the mathematics taught at the k to 12 level.


Error bars on grading

Educators make mistakes when grading. It happens. Sometimes we mark a student’s work lower than we should, compared to their peers, and sometimes we mark it higher than we should. The question is, what effect does this have on a student’s overall mark?

Here are some sample grades. The sample column is the original grade, the low column is a mark 1 lower than the sample, the high column is a mark 1 higher than the sample.

Grades Sample Low High
Quizzes 5 4 6
  6 5 7
  7 6 8
  5 4 6
  6 5 7
  7 6 8
  5 4 6
  6 5 7
  5 4 6
  6 5 7
average 5.8 4.8 6.8
 
Homework 5 3 5
  5 3 5
  3 1 5
  3 1 5
  1 1 3
  1 1 3
  3 1 5
  5 3 5
  3 1 3
average 3.222222 1.666667 4.333333
 
Tests 40 35 45
  45 40 50
  35 30 40
  40 35 45
  30 25 35
average 38 33 43
 
Overall Grade 70.1 55.9 82.5


The overall grade was calculated here by finding the averages of the three categories (quizzes, homework, and tests – standard categories in many classes) with quizzes worth 20%, homework worth 20%, and tests worth 60% of the overall grade. These aren’t particularly unusual grades. Note, however, how wide the possible error is in the final grade, which could potentially actually range from 55.9% to 82.5%, which is a 26.6%, or a HUGE amount in any grading system.

Of course, teachers aren’t likely to mark everything low, or everything high. One could make an assumption that both of these cases are equally likely, and then instead of using the likely minimum mark, and the likely maximum mark, we could try and aim for 2 standard deviations from the mean of the possible grading outcomes. In other words, what’s a likely range?

I created a script (warning: takes a while to run in some browsers) which randomly generates a sample of 10,000 overall grades, starting with the baseline above, and randomly adding errors in grading for each assignment, assuming that teachers were equally likely to assign a lower grade as a higher grade, and as getting the grade exactly correct (this assumption is probably false, but I had to start somewhere). For one sample of 10,000 grades, the minimum grade is 60.2, and the maximum grade is 77.5, suggesting that the distribution of grades isn’t symmetrical (teachers are more likely to assign a grade which is too low to students who are at above 50% overall, and too high for students who are at below 50% overall). The standard deviation of these scores is 2.32, which means that 95% of the time, the grade will fall between 64.6% and 73.9% (the mean of the data set was 69.2). This is a range of likely values of over 9%!

Note that this script doesn’t account for a host of other reasons that the grades for this individual student could be in error. It doesn’t account for lost assignments, misread names, addition errors, etc…

How many teachers know that there are error bars on the percentages they are expected to give to students? Maybe if we reported this student’s grades as 70.1% ± 4.6%, students and parents might recognize that grading is more subjective than they realize? Maybe we could stop the practice of assigning letter grades to students work based on strict boundaries?

I remember than in grade 12, I was assigned a grade of 84% overall in English 12, with an A being an 86% in my school. This meant that I missed out on a major award at university (it was my only B in grade 12) and that I had to write an entrance exam to get into my first year English course (I passed). I’ve obviously done fine despite this grade, but I remember it often, and it is a reminder to me of the often arbitrary nature of teacher assigned grades.

Math in the real world: Marshmallow constructions

This is another post in my series of posts on math in the real world.

Building materials

My wife, son, and I  went to a kids science event at SFU today, and at one table they had some marshmallow diagrams set up to demonstrate molecules. They let the kids play with the marshmallows and toothpicks, so my son made a giraffe. When we got home, he helped himself to some marshmallows and toothpicks and continued to make things with them.

Simple diagram


My son noticed that the most stable form included triangles (with some help from mommy), so he started to construct everything with triangles. When he moved into three dimensions, he noticed that the tetrahedron was the most stable of the forms he could build and so his construction soon began to look very mathematical in shape.

More complicated diagram


Now in his most complex form, he has started to build a three dimension tesselation. If he hadn’t been called away to dinner, or if we hadn’t been running low on toothpicks, I’m sure he would have continued the pattern.

Very complicated diagram


This activity involves both 2d and 3d geometry, tesselations, sequences and other patterns. Can you think of other mathematics that can be found in this activity?

BC’s personalized education plan

At 1:53 of this video, the BC Ministry of Education shares a need to give more flexibility into the current system for how, when, and where they learn, but they’ve forgotten an important option: what they learn.

In a world where total knowledge is increasing at an exponential rate, it is impossible to determine what the best subset of knowledge should be that everyone learns. Further, true personalization of learning comes when one has choice over what one learns; when one is the director and producer of one’s life, and not just an actor in it.

A couple of ideas I like for addressing this need are the Learning in Depth project, and something akin to Google’s 20% time. Students could use the time to learn more about their own culture, get involved in mentorship in a workplace, improve their free-style skateboarding, or anything other learning that they would be willing to document for their school and community.

Nowhere Was Home: The Street Kids and Their Truth

In 1993, my father interviewed street kids to find out what living on the streets was really like, and how kids could end up on the street. He self-published his work, but unfortunately, I don’t feel like his book got the audience it deserved (or needed).

Two and a half years ago, my father passed away. He left a lot of stuff unfinished in his life, so I’m trying to complete some of the tasks that he was working on. One of these tasks is sharing the stories he collected from street kids.

A few days ago, I found the text of his book in a file on his website and decided to publish it through the Amazon Kindle store, so that it can be shared more widely. The stories in his book are sometimes hard to read, but they are an honest account of what it was like to live on the streets in the 1990s. They an indictment of the realities that street kids still face in our society. These stories need to be read and shared.

Here’s an excerpt from his book:

Even things that I didn’t know if they were right or not, I really wanted to experience them so that I could make up my own mind. By the time I was fourteen, I was beginning to assume that everything my parents told me was lies, so many things had been. So I just wanted to go out and experience what most people would call the seedier side of life. But I had to be in by six o’clock every night.

Nowadays you might say, "Well, compared with living on the streets I would have put up with the rules." But I didn’t expect to be kicked out of the house and never allowed back. But once it was done, it was done, and I really relished the freedom.

I have always felt that even a bad experience has some value. It was very exciting being on the streets. It was terrifying and it was dangerous. And it was all new experience.

I used to sit long hours and talk to all the winos. They’d tell me their life stories.

Life on the street gave me a new perspective on people I had been like just a few short months before; people like my family and the kids and families I had grown up with … just how unwilling they are to become involved and lend a hand in anything that they are afraid will happen to them. I would sit on the street and watch all the people going by who were exactly like my family, and like I used to be, up until a couple of years before. I would think on that and how hard they were trying to keep their blinders on. What an effort it took for them. I never realized that before. How much work went into maintaining their illusion that nothing was wrong. It was a very enlightening experience. I can’t do it again. I could never ever live on the streets again because I know a lot more now, and it’s too dangerous. Back then .. some nights I wouldn’t sleep all night because I was so terrified.

But other nights because of youth and the feeling of immortality that comes with it, it would just be exciting and interesting. But now there is no way I could spend even one night on the streets because I know what could happen, and that it’s very likely to happen.

I kind of miss that stupid courage. It was ridiculous. But I’d like to have that feeling. I was really tough back then because I realized I could be tough. I was accosted day and night by slimy men. They would come on to me "Oh, let me buy you a drink." I had to be very very tough to protect myself from that. I miss that toughness. It was a real shield that I had. I felt very strong when I was on the streets. I miss that.


I’ve put the price of the book at the minimum that the Kindle bookstore will allow. For just $1 US, you can download his book to a Kindle device or to any Kindle application. I plan on giving what proceeds of this book I do earn to my sister, who is currently struggling to make ends meet on a disability pension, so this is also an opportunity to help out someone in need.

You can find Nowhere Was Home: The Street Kids and Their Truth here.


First review:

I bought this book yesterday and tore through it in a couple hours. It is absolutely amazing.

The stories of these individuals range from the empowering to the heart-wrenching. They will stay with you for as long as you let them.

I would love to find a way to share this book with as many people as I can. I don’t normally write reviews for the books I read (who cares what I think?) but I had to write one for this one. It’s too powerful. People need to know that this is something worth reading.


Grading is a compression algorithm

The objective of traditional grading is to compress information teachers have gathered about a student down into a single score to make understanding the information easier. One of the original reasons for this compression was the limitation on how much information could be shared on a single piece of paper. One of the purposes of comments is to uncompress the grade a bit, so that parents and students have some ideas on how to improve their grades.

This process is used to change the size and quality of pictures as well. Compare the two pictures below, and ask yourself, which one conveys more information?

high quality Low quality


Is there a way we can share information parents and students can understand, while not reducing the information too much?

I flipped my math classroom

I’ve normally started my classes with a description of what math we will be learning, and a class discussion about what the math means. 

When I first started teaching, I would lecture for 30 minutes, and students would work for 60 minutes (I started in with a double block of math) during double block math classes, and in a 45 minute lesson, I would still lecture for 30 minutes, and students would get 15 minutes to practice and do other activities.

I discovered early on in my teaching that the less time I talked, the more time students had to work on activities and exercises, and this led to improved understanding. I read research suggesting that adolescents could actively pay attention for about 10 – 15 minutes, so I focused on getting the lecture portion of my lesson down to this length, and on embedding more questions and subsequent discussion into my lecture.

Today I tried something new. I found questions (with an emphasis on real world application) related to exponential functions that students had never seen before, and started class by handing them out as a package, and asking students to work on these problems in groups. I then spent class circulating around the room, answering the occasional student question (but being very careful what types of questions I answered) and pushing students to try finding multiple solutions to the problems. When students were completely stuck, I offered support, but by asking them questions, rather than just giving them the solution.

Now, I’ve definitely had classes where I haven’t taught an idea to the entire class before, but this is the first time I’ve introduced a completely new topic without either presenting a lecture on the topic ahead of time or using some sort of guided instructional aid for the students (like a video prepared in advance of the lesson).

Here are some observations I had while I was circulating around the classroom.

  • Not one student asked me "is this solution right?"
  • Students were actively engaged in the problem solving process.
  • The questions I overheard from students (to each other) were often about the nuances in the problems, rather than "how did you do this?"
  • Every group of students found the most efficient standard solution to the problem, as well as 2 other ways of solving the problem.
  • No one attempted to Google for the solutions, or even open their textbook to see what information it had.
  • My students were thinking.

At the end of class, I asked students to continue working in groups and come up with notes to explain the topic. As the students will be taking an exam in about a year and half on all of the material they are writing, I recommended that they write the notes for their future self that might not remember having worked on these problems. Next class, I plan on having students form new groups, and collaborate to construct meaningful notes for the future, and then work on some more related problems.

I’ve flipped the classroom. Instead of me presenting the ideas, my students look for solutions, and I help them. Instead of me giving notes to students, they make their own notes. Instead of the classroom being about the content, it’s about the process.

There were no videos, no notes in advance, no computer assessed exercises; just a focus on changing who was doing the thinking.


It’s time to redesign the report card

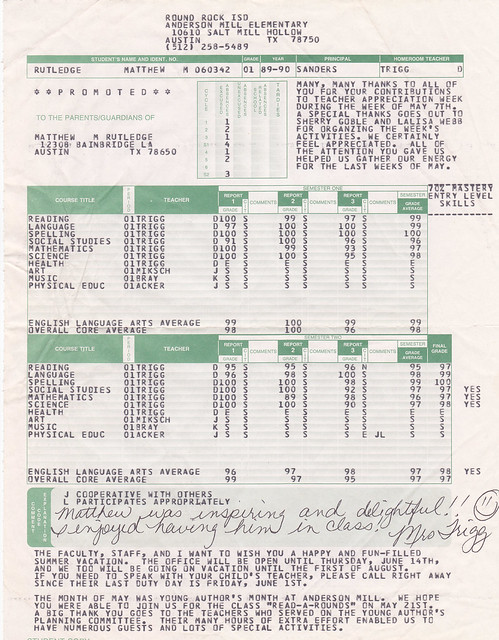
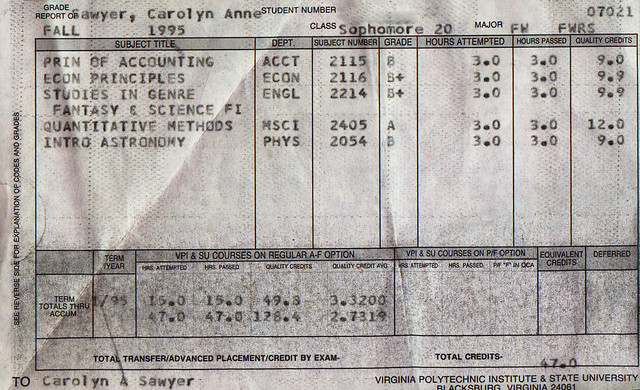
The typical report card looks like this (click to embiggen):

image credit: rutlo

image credit: Richard Giles

image credit: clintjcl


A problem with these reports is they do not share with parents information that can be used to help their children improve their learning. What they share is information that is helpful to rank their children with respect to the other children in their classes. They are essentially an autotopsy of learning, rather than a document which can be used to help students improve.

A child who does "poorly" is rarely given sufficient advice to help them improve via their report card. Most comments from teachers are of the "what did David do wrong" variety, rather than "David should do x to help improve learning." A child who does well on their report card is given a free pass, and rarely pushed to extend themselves. The comments you put on your report cards should be ones that help students improve. Canned report card comments are a waste of time! If teachers do not have time to give appropriate comments for each of their students, that points to a systemic problem with classroom size (and workload) and that can’t be rectified by adding useless comments to report cards that teachers can just select.

I don’t think that online grading systems are the answer either. These lead to situations where teachers are forced into an unhealthy practice (grading everything students do) just so parents can always keep on top of the "progress" of their students. It is counter to the purpose of formative assessment to include it in an overall summative grade, and it is counter to the purpose of a summative assessment to include everything students do. Students also need a bit of freedom from their parents in order to experience this learning process themselves, and having their helicopter parents whirring around all the time checking in on them is counter-productive to them developing their own sense of independence.

We’ve used student led conferences at our school, which are an opportunity for students to show to parents directly, the results of their learning, based on portfolios our students have constructed. We are hoping to eventually have these portfolios be online, and I’d like to see the specific assessments students have done linked from their report cards. These experiences are far more valuable, both for "strong" and "weaker" students. They do have issues; not every parent takes the time to come and see their student’s work, and not every student is able to adequately explain how well they did.

I wonder what a report card that was sent home that just listed student’s (apparent) strengths and weaknesses would look like? Could you send home information that helps students improve, rather than information which helps them be numbered?

Could we design an electronic report card that gave far more information than our current ones do? What would a report card with each assessment criteria for the year, and how well our students did on each look like? Would that be too over-whelming? What if we sent home a link to an eportfolio for each student, with suggestions and comments for how to improve attached to each assessment the student does? What would happen if we gave students more ownership (perhaps with some oversight to start) over how they reported their learning to their parents?

I don’t have the answer to what the report card of the future should look like, but I do know that our current report cards need improvement.