The Reflective Educator

Education ∪ Math ∪ Technology

Open Source Middle Years Programme Curriculum

A few years ago when I worked for New Visions for Public Schools, we created an open-source curriculum to support teachers with understanding and implementing some of the instructional and curriculum shifts the Common Core standards required. 8 years later, that curriculum was the 6th most popular curriculum in US high schools, with nearly 6% of high schools surveyed indicated they were using it. The leading curriculum in the US only had 6.8% of schools reporting usage. At this point, this curriculum no longer had a public website and had to be shared person to person in Google Drive.

Why was this curriculum so popular? It has features similar to the Illustrative Mathematics curriculum but that’s hardly unique. The curriculum we wrote wasn’t even totally complete as there was many gaps in content coverage in the Geometry and Algebra II courses.

My suspicion is that our curriculum was popular for three reasons. First, we were a solid and coherent curriculum and not just a collection of random resources. Second, we had designed flexibility and formative assessment into the curriculum. Instead of providing a single pathway for teachers, we provided a set of core resources and supplemental resources to allow teachers to “choose their own adventure”. Finally, and probably most importantly, we provided our resources in a format that can be edited and included a license that allowed edits. So many other curricular resources are locked in PDFs that cannot be edited and in some cases, cannot even be printed.

What I’m working on

I’ve been working on a project to develop a set of similar structured and free, open -source curriculum for the IB Middle Years Programme, aligned to the AERO international math standards. The goal is to provide a curriculum that educators can modify and adapt to meet their local needs by default. Where I will make a return on my time investment is by providing professional learning and adaptation services related to this curriculum to schools.

So far I have created a visual representing the connections between AERO Math standards, and grouped those standards into units for each course (Year 1 through Year 5). For each unit, I have broken the units into big ideas, representing a week’s worth of instruction, and broken those big ideas into daily goals, both carefully aligned to the standards themselves. Everything lives in Google Docs and is carefully linked and organized. My next step is to write assessments aligned to the MYP criteria (Knowing and Understanding, Communicating, Investigating patterns, and Applying mathematics in real-life contexts). Once I have the content in place, I will then layer in the key concepts, global contexts, and approaches to learning (and probably iterate on some of the assessments as a result).

The plan for licensing this work is to use a Creative Commons, Attribution Required, Non-Commercial Share-Alike license. This will allow educators to make changes and share those changes with others, but not to post the resources on Teacher’s Pay Teachers or create a paywall preventing access to the curriculum.

A call for contributors

If we look at other open source projects though, they benefit from collaboration from other educators. I’m putting out a call to all IB Middle Years Programme educators who would like to contribute to this project. Contributions can be small, such as testing out resources pre-publication, to being full editors and curriculum authors.

Contributors will get acknowledgement of their contributions, and with sufficient contribution, licensing agreements can be made to allow for authors to provide “add-on” services on top of the curriculum (such as consulting or curriculum adaptation services for schools).

If you are interested in contributing to this project or have ideas on how to make it better, feel free to contact me privately or leave a comment on this post. Everyone who expresses interest will be put on an email list, with the ability to leave any time.
The Purpose of Assessment

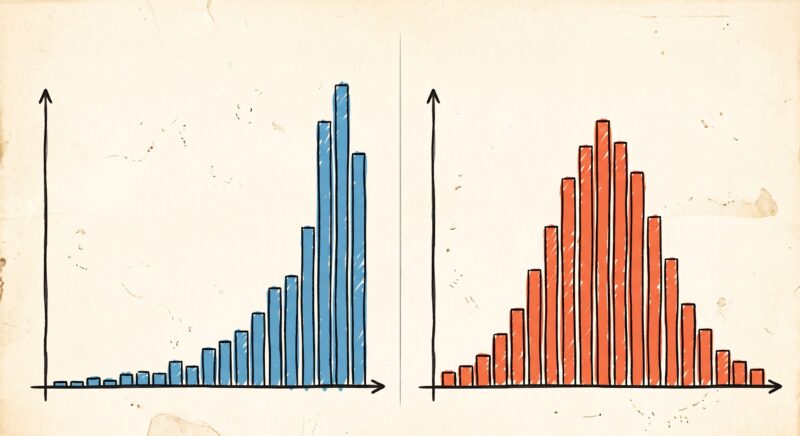
Which assessment results are better for classroom instruction? Which assessment results are better for the end of a course?

This image shows two histograms. One is heavily skewed to the left, with almost all the data at the top-end of the scale. The other is a normal distribution with the mean roughly in the middle and all the data visible.

Most people prefer the results on the left. It means the class is doing well, relative to the assessment. That’s great! The problem with it as a classroom assessment though is that there are bunch of students that we don’t know what else they are capable of doing. By contrast, the results on the right mean that, relative to the assessment, half the students are failing! That seems awful, but as information to the teacher, it’s incredibly valuable. There is no lost information in the assessment about what children know or don’t know.

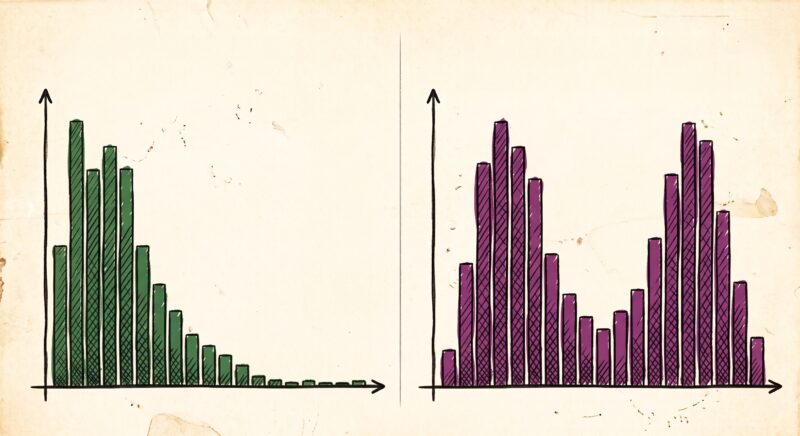
What about these results?

This image shows two histograms. One is heavily skewed to the right, with almost all the data at the bottom-end of the scale. The other is a bi-modal distribution with the mean roughly in the middle and all the data visible. The two modes of the data are split, with one on the lower end and one on the upper end.

Everyone agrees that the results on the left are not good, but for different reasons. When we get results like that it means not only did the children not do well, relative to the assessment, but that there are a bunch of children where we don’t know what else they might not know. The lower end of the scale is hidden to the observer. However, if the goal is to find really brilliant people who can achieve high results even on a very challenging assessment, then these results are perfect.

Similarly, the results on the right are also challenging, because what do you do instructionally? Should you reteach everyone, even though many students clearly have significant understanding?

What informs which graph we prefer to see is our goals for the assessment. When we design assessments, we need to keep our goals in mind.

For classroom assessments designed to find out what students know about a topic, we ideally want every student to experience some success on the assessment and we want no student to be able to complete all of the assessment accurately.

Here’s an assessment from the Mathematics Assessment Project which aims to achieve this goal: learning what all students understand about building a function that models a relationship between two quantities.

The image shows two pages of an ramped assessment task, where each problem gets progressively more challenging, but where the first problem should be doable by all students.

How these tasks work is the task is ramped, which means that ideally all students are able to start the task, and then eventually almost all students run into knowledge and skills they don’t know how to do. This increases the instructional value of the assessment.

For assessments designed to rank and evaluate students according to how well they understand a course, and then report overall results back to the learner, we want results that favour most students passing.

Since many classroom assessments that inform instruction are also used to rank and evaluate students, we run into a challenge where the ideal results to inform instruction look terribly to parents and students trying to understand how well they are doing.

A solution to this problem is to keep two sets of data for each major assessment. One set of data is intended to inform instruction and the other is to help parents and students see how well they are progressing in a course. Since the first set of data is intended to inform instruction, the ideal form of those data is descriptive information about what learners know and what strategies they use. The second set of data can be generated from an assessment by using a rubric or scale that takes the results and scales them to whatever level of achievement is normative at the school. This way one assessment can achieve both aims. It can be challenging and tell the teacher what children know and don’t know and it can help parents and students see growth and good performance.

The main ideas are that the form of our assessment should be informed by the goals of that assessment and that it is possible to use an assessment in more than one way, depending on how we report the results to students and parents.

Start With Formative Assessment

If I’m only allowed to pick one thing in order to improve instruction at a school, I’d start with formative assessment. Why? Every other improvement relies on it.1

Crucially, one cannot know if a change is an improvement without having a metric with which to measure that improvement. Educators need to know if something they try works, and the answer to whether it works is, “Did it improve the thing we were hoping to improve?” Knowing whether something has improved relies on measurement, which means that one needs to get good at measurement before trying anything else. Formative assessment is the easiest way for educators to enact measurement in a way that will support their teaching efforts rather than detracting from them.

Obviously, there is research about what kinds of things work or do not work, but this research is usually hard to find, hard to interpret, and hard to contextualize. It would be ideal if educators had time to pour through the research to see what will work in their school contexts, but educational research is mostly scattered, disorganized, and unusable.

Formative assessment can be immediate (which students should I pick to answer this question?), short-term (how well did students understand this lesson?), or long-range (how well are students learning this subject?). In all three cases, educators get information they can use to judge whether some improvement effort they are making makes a difference. One does have to be a bit careful with immediate and short-term formative assessment to ensure that they match the long-term assessment results, as performance is not the same as learning, but most improvements will carry through over any time-scale.

Formative assessment is generally affordable, scalable, and unobtrusive as far as changes in schools go. It doesn’t mean it’s easy! Lots of schools confuse formative assessments with the formative assessment practices but any level of following formative assessment practices is an improvement over not using formative assessment.

The greatest strength of formative assessment is that it gives educators and their students information about how learning is going, which is crucial to any other kind of change you might want to make in schools.

How Humans Are Smarter Than AI

Fawn Nguyen recently updated her terrific Visual Patterns website and mentioned how she used AI to help her rebuild the site. She also updated the patterns on the website to all use squares instead of some of the random shapes previously used in patterns.

This got me wondering: how well can AI make sense of the patterns themselves? I decided to do some investigation.

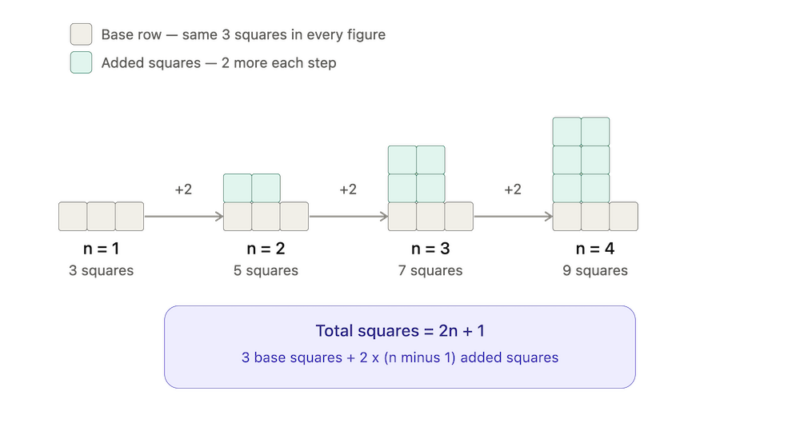
I uploaded this pattern to Gemini.

A growing linear pattern

And this is Gemini’s response when asked to analyze the pattern and determine a rule matching the pattern, and then annotate the image to make it apparent how the rule matches.

Gemini’s first attempt

I decided that this response was a bit too detailed, and asked it to simplify the image and focus on the annotation instead of including all of the explanation on the image itself. For a simple linear pattern, Gemini’s output is more than adequate (although, it does have an error in the figure n element of the image).

Simplified annotations

Next, I tried this same task with Claude.

Claude’s attempt at a linear pattern

Interestingly enough, Gemini and Claude have different ways of decomposing the visuals to represent the linear pattern. The simple task that a 6th grade student can do was completed by both AI tools I tried.

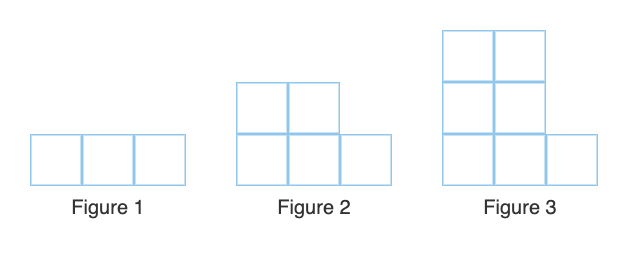
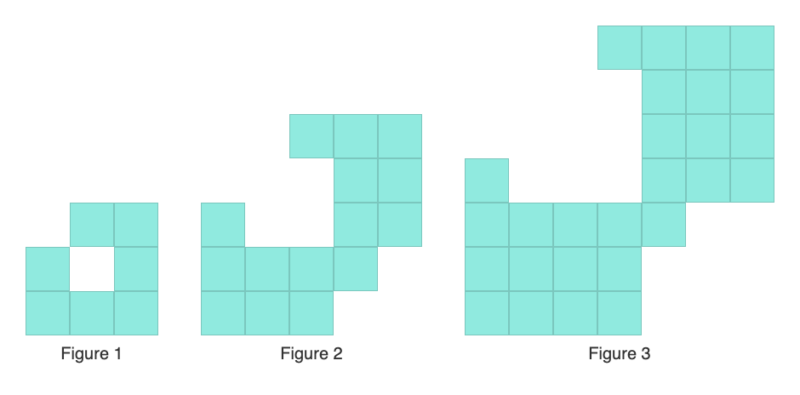
Next, I moved onto a more complicated pattern. I fed this quadratic pattern into both tools to see what the AI models could do with it.

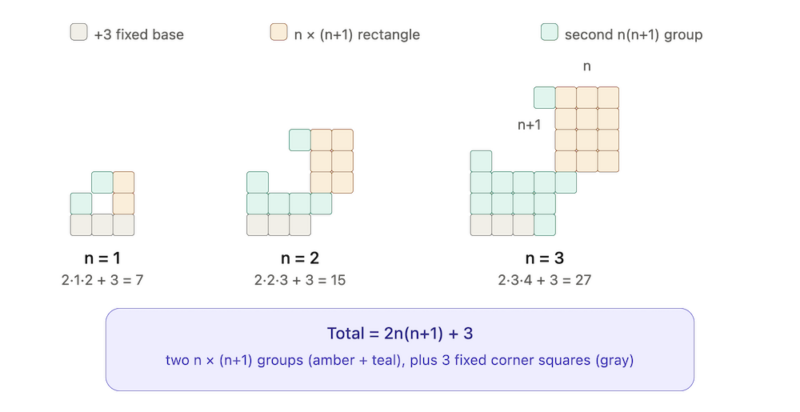
A growing quadratic pattern

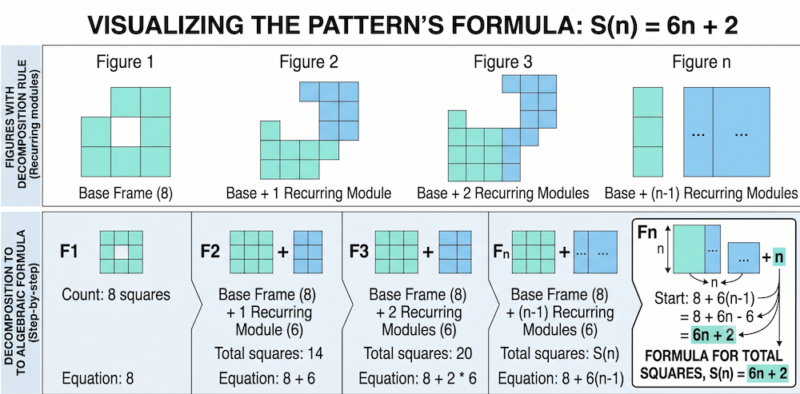
This is where the AI models struggled. Initially, Gemini treated the visual as a growing linear pattern, and tried to get their annotation and formulas to match linearly. Claude simply did not attempt the annotation at all, although it seemed more aware this pattern is quadratic in nature.

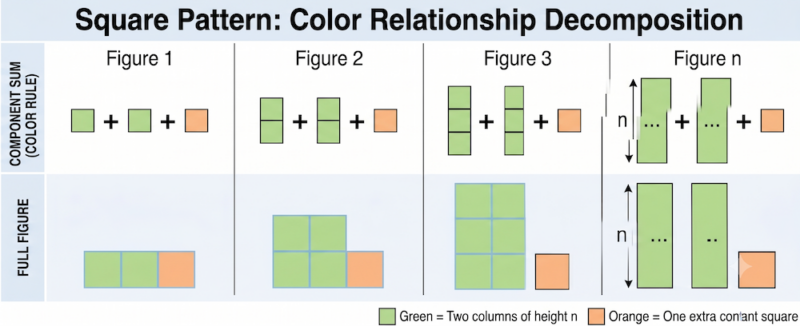
Here’s Gemini’s output. There are obvious errors in the output, including Gemini completing missing a column of the right part of the 3rd figure.

Gemini’s fit to a linear pattern

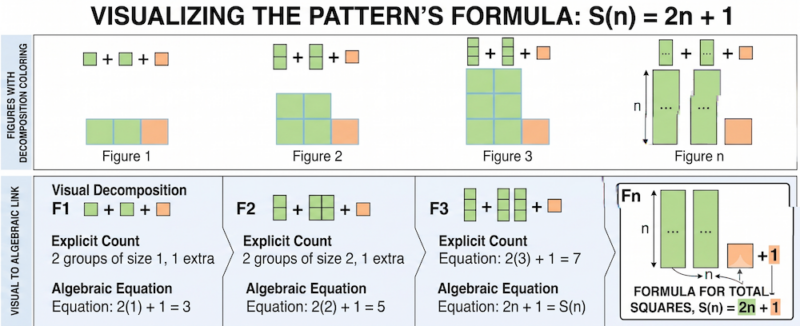
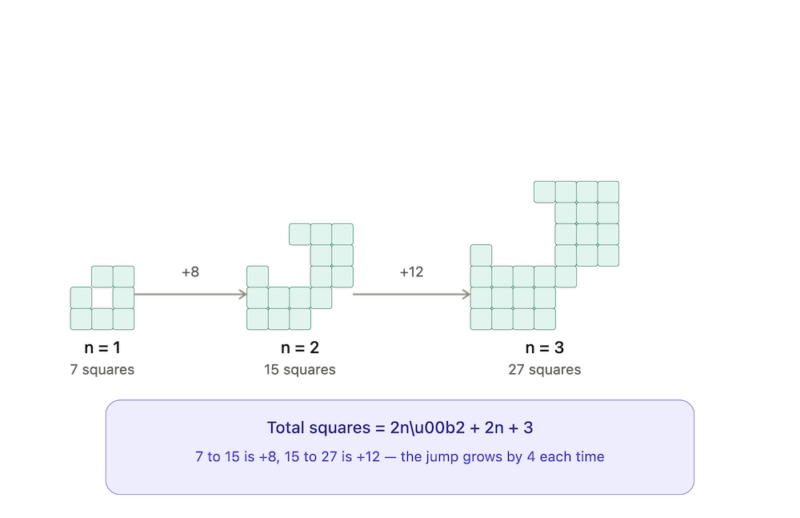
Here’s Claude’s initial attempt. Notice how the AI model does not follow my instructions on visually annotating the pattern and instead just counts the squares and comes up with a formula. This formula also isn’t displayed correctly.

Claude’s first attempt: no annotation

I asked Claude next to make explicit and direct connections between the visuals and the formula. I even told Claude another form of the formula is Total squares = 2n(n+1) + 3. Here’s what it came up with.

Claude’s attempt at annotation

Notice how it tries to fit the +3 to the three squares at the bottom of the image, even though these three squares are not what most people who see this image think of as the constant part of the image. On the other hand, at least Claude is able to correctly match the value of n to the formula and has shaded the right number of squares. It doesn’t make use of the structure of the shape at all.

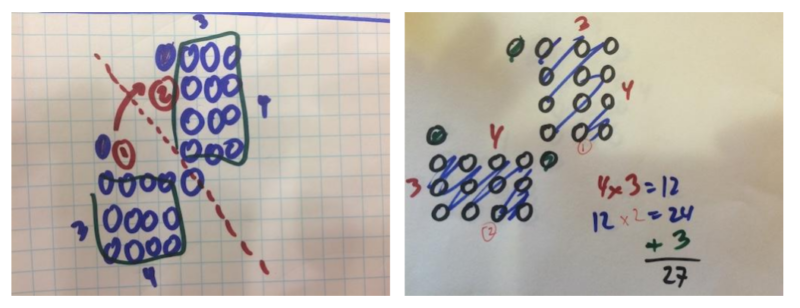
Here are a couple of the ways my students have seen the structure of one of the terms pattern over the years. Notice that the structure is very clear, especially the symmetry inherent in each figure of the pattern. While these images do not explicitly show students making connections between a formula and the figures, my 8th grade students this past semester could nearly all visualize this relationship and come up with it on their own.

Student annotation of strategies


The human mind makes use of visual structure in a way that the models I tested did not. The AI models I tested, which are the general free models available to consumers, are not yet as “smart” as middle school students in seeing and making use of mathematical structure.

This amazes me in a way, since I recently read that some of these models have made headway on incredibly complex mathematics and even outputted proofs or counter-examples to theorems not yet proven by mathematicians.

Feedback in Digital Learning Systems

There are three different ways the word learning is used, and all of them are important. Educational technology companies usually pick one of these forms of learning to focus on, but to be effective, their products really need to do all three. The feedback systems built into their products need to find ways to support all three learning scenarios.

  • Learning as the introduction to ideas
    This is the most commonly way of understanding learning. A learner doesn’t know something and they are exposed to information that gives them new insight about the world.2 This exposure may take the form of explicit instruction or it could be as part of a guided discovery. Learning is measured by student performance on tasks completed closely related to the ideas to which a student was exposed. Improving learning is focused on either improving instructional delivery or on improving student performance on follow-up tasks.
  • Learning as the activity
    Sometimes learning is defined as the activity students do that results in their engagement and some measurement of performance, and this activity does not include being introduced to new information. For example, students who complete a worksheet can be said to be in the act of learning. Learning is measured by how much students participate and complete work. Improving learning centers around improving engagement with the activity.
  • Learning as long-term change
    Graham Nuthall, author of the Hidden Lives of Learners3, defined learning as the longterm change in what students know, believe, and can do. With this model of learning, students can be exposed to new information, complete activities, and not learn anything because the ideas didn’t stick. Learning is measured by longterm assessments measuring knowledge and skills gained over months and years. Improving learning centers around long-range strategies and finding ways for learners to remember ideas they have learned more robustly.

If one is designing a digital learning experience, all three of these ways of understanding learning need to be addressed. Ideas need to be introduced to students, students have to complete activities, and long term changes in what students know, believe, and can do should be measured.

Most educational technology solutions focus on introducing ideas to students or engaging students in activities and sometimes both. Very few products focus on ensuring students have changed in the longterm, where ironically, accountability for schools focuses nearly entirely on this aspect of learning.

Feedback while introducing ideas

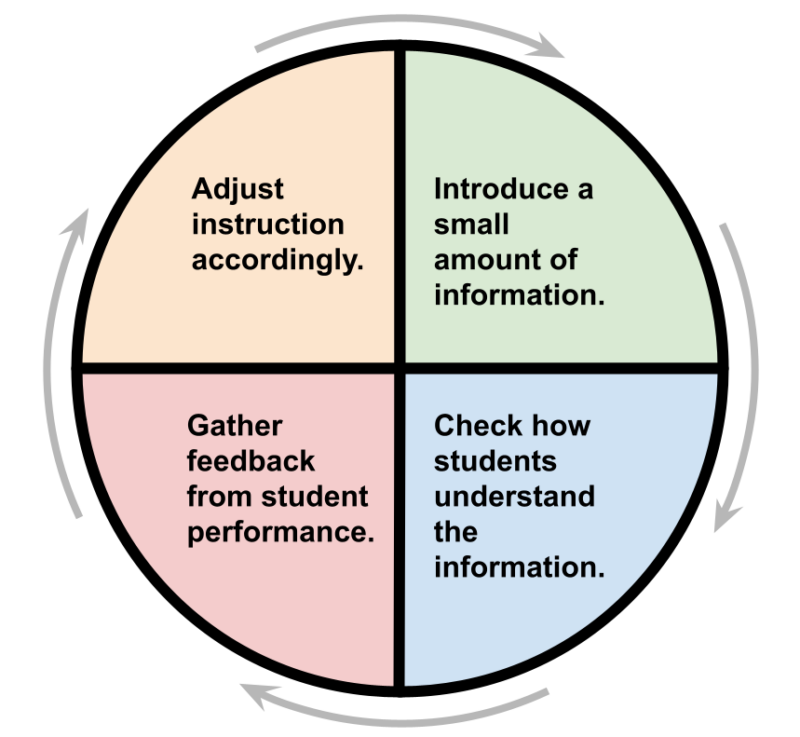
When introducing ideas to students, it is an excellent practice to frequently check to see if students understand an idea. It is even better practice to check how students understand a new idea! One can then adjust instruction based on the feedback to the instructor. Ideally, this results in short cycles of introducing a small amount of information to students, engaging students in an opportunity to demonstrate their understanding, gathering evidence of that performance, and adjusting instruction.4

The image shows a circle demonstrating a cycle with four different stages.
Introduce a small amount of information.
Check how students understand the information.
Gather feedback from student performance.
Adjust instruction accordingly.
A useful instructional cycle

Here the feedback is mostly to the instructor and they make decisions about how to adjust their instruction that result in new information (e.g. feedback on learning) being given to learners.

Most educational technology products are not this deliberate in how they introduce information to students, and even the ones that include small incremental steps when introducing information do not consistently change their instruction as a result of a cycle like this.

Further, the information provided to instructors about student performance is generally unhelpful. Knowing that children have completed this activity or that activity (information typically provided in educational technology products) is less helpful than knowing what kinds of mistakes students were making and how to support students (information never provided in educational technology products). The lowest hanging fruit in reporting is completion data, but the closer the data is to the actual work students did, the more likely it is to be helpful. Imagine a product that takes all student work from activity and synthesizes it into the three to five most commonly used ways of thinking students had during the activity and then suggests activities instructors can do.

Feedback during activities

Key among the strategies educational technology companies have promised over the years is personalized feedback to students. Unfortunately, few products on the market deliver on this promise. If your product contains digital explanations, showing them an explanation of why they are wrong after they get an answer incorrect is the digital equivalent of reteaching by talking louder and slower. It doesn’t work. Feedback in those moments should depend on the thinking children have done, and few products include robust enough student testing in their development lifecycle to be able to create the feedback opportunities that actually work.

An alternative way of presenting feedback to students is to select a different task for them to work on. Perhaps a student is having trouble with 102 – 94 and you want them to think about this problem differently. A teacher would know that a related problem in the moment can be transformative and ask that child to try solving 100 – 94. If this is still a struggle for the child, they can try 100 – 95 first, then go back to 100 – 94, and then go back to the original problem of 102 – 94. To mitigate this struggle in the first place, one could reverse this sequence of problems, but then one might not know if the scaffolding led the child to the idea of changing 102 – 94 to 102 – 100 + 100 – 94 or if the child can do this independently. Using tasks to provide feedback is one of the more powerful instructional moves a teacher can make and most educational technology products do not even attempt to use it.

Feedback during long-term learning

Durable long-term learning is really about supporting students with revisiting ideas they to which they have already been exposed. Our brains are designed to ruthlessly trim ideas from active recall that we do not use frequently. This means, if there are things we want to remember, we either need to make the experience of learning them extremely memorable, or we need to spend effort thinking about those ideas again periodically.

No educational technology products on the market today deliberately and systematically offers students opportunities to revisit ideas over time. Every product assumes that once children have demonstrated proficiency with an idea that this proficiency is stable and unchanging. This is demonstrably false! We all know that learners forget things over time.

Spaced opportunities to revisit ideas learned is in the best interest of learners. Educational technology has the ability to track what students have demonstrated proficiency in, and to keep track of the hundreds of ideas that students should revisit and at what intervals they should come back. There is very solid evidence that spaced, interleaved repetition and practice lead to long term changes in memory.

Conclusion

There is a need for educational technology to be better than it is. More deliberate systems and focus on improving feedback in a product is one way nearly every product on the market can improve. They need to move beyond simplistic models of learning (the student completed an activity so therefore they “know it”) to models that include all three ways of understanding learning.

We need an education system

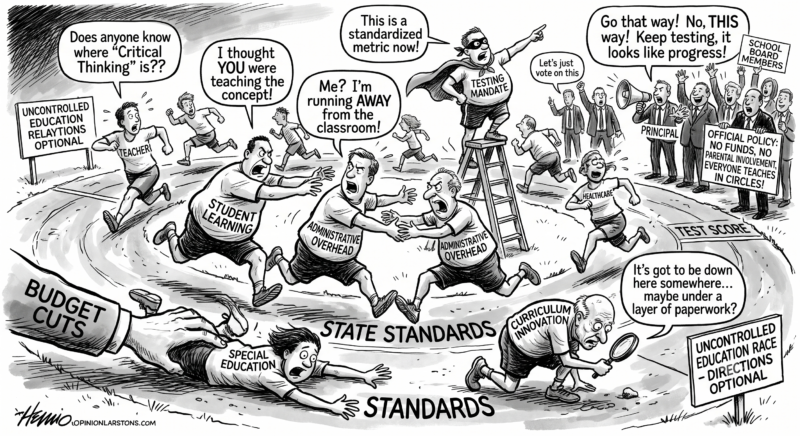
Our current “system” of education is actually hodgepodge of different competing organizations layered on top of each other. It’s not actually a system at all.

If you compared our system for professional learning to a relay race where each organization in a teacher’s career should pass the baton of learning to the next organization, it’s instead like a race with people running in different directions and there’s no baton in sight.

The education relay race

Our system for student learning is slightly better, if only because students tend to stay within the same school for a number of years and schools tend to be a bit better about internal consistency across year levels. Still, in most schools what a child knows about a topic from the year before is almost always lost by the time the related topics come up in the following year. In fact, despite the fact schools collect mountains of information on each child in a year, most of it is discarded before the following year. Remember, every worksheet a child does contains information about their performance at a moment in time.

Our systems for connecting educator learning to student learning are at best aspirational, with almost no schools anywhere linking the two. When was the last time you heard in a staff meeting, “We see students need support with ____ so we need to learn ____”? It’s just not done. In the best schools, teachers get autonomy to decide what to learn based on reflecting on their work with students, and in the worst, educator professional learning is neither professional nor does it result in learning.

We need a stable set of goals for students, so that we can measure student progress toward those goals and make decisions from that information. We need agreement on the relative importance of those goals, so that we stop shifting goalposts year after year. We need to create our system by working up from student learning and not down from ministries of education, so that every link in the chain of the system is built carefully based on evidence of impact.

Observing Math Classrooms

Now that I’ve been coaching math teachers again, I have been in a lot more classrooms and doing classroom observations again.

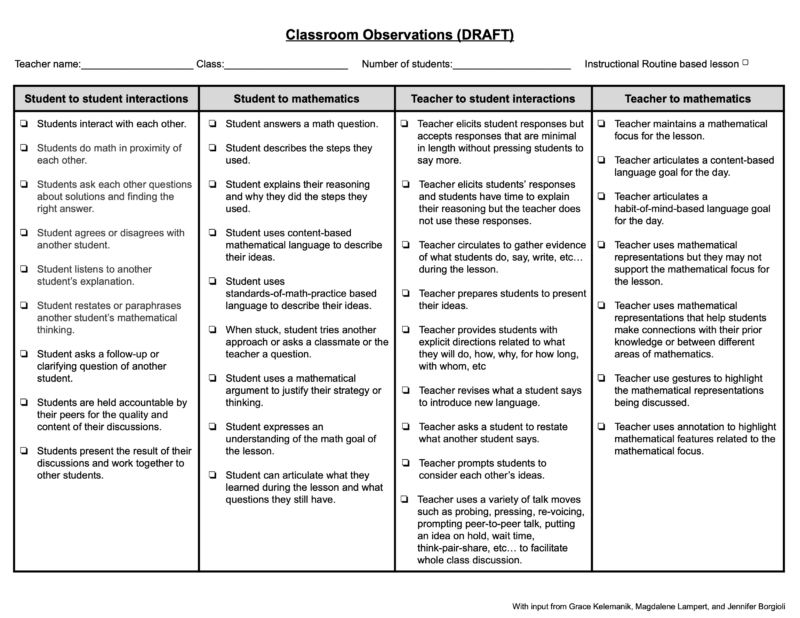
In a past iteration as a math coach5 , I created this checklist of things6 to look for explicitly when observing teachers. The goal at the time was to be able to have our team have a clear list of observable behaviours so that we could measure whether our professional learning work was landing with teachers. With 8 instructional coaches and 30 schools in our project, we needed something that would work at scale.

A checklist of different behaviours one can observe in a math classroom broken into 4 different categories: student to student, student to mathematics, teacher to student, and teacher to mathematics.
Available in a larger size

We created curricular resources for teachers, ran workshops for teachers to teach them how to use the curricular resources (via modeling, rehearsals, and dialogue), and then coached the teacher leads at the schools. We would then observe teachers in their classrooms and teacher leads in their meetings, so that we could learn whether our work was landing. Over time, we iterated and improved our approach as we learned from what we did.

As an individual coach though, my goals for lesson observations are tied to the coaching work I do with teachers. The teacher I’m coaching and I decide together what I should focus on when observing them, and I spend much more time learning alongside the teacher instead of just sitting back and passively observing their classrooms.

I’ve since been heavily influenced by Elham Kazemi’s (et al.7) Learning Together so that instead of trying to transmit what I know to the teachers I work with, I work with teachers to try out different strategies to see what works with these students in this context, focused heavily on instructional goals informed by our conversations, data we have collected, and the goals of the school. I still do typical coaching ‘moves’ such as modeling instruction, observations, and leading team meetings, but these are in service of our shared learning.

Neither of these approaches are better than the other. They are meant to serve different types of structures and sets of resources available. But both are meant to serve the main goal — the learning of teachers in service of student learning. One’s strategy for coaching should match the available resources one has and the goals one has for that coaching.

I like Graham Nuthall’s definition of learning as ‘long-term changes in what learners know, believe, and can do.’ From this definition, we can see that one cannot directly observe student or teacher learning from a single lesson observation; all one can observe in learners are behaviours that are likely to lead to learning. Lesson observations therefore also have to be paired with collection of other kinds of data, including student performance data collected over the long term, and data about changes in teacher practice that are sustained.

Either approach therefore will require a longer term view. It’s hard to see if long term changes are making an impact as well, as one needs both a control year (how much did students change this year) and a treatment year (under this new strategy, how much did students change). You also need time to see if the strategies you and teachers learn stick, since you are learners too! My recommendation is to make sure to study the impact of your work and repeatedly iterate on both your coaching approach and the teaching strategies your team tries, until you see the results you want.

School Culture and Math Teaching

School culture trumps great teaching, or it can.

When teachers try to teach the way they think is best, they do so while navigating the culture of the school and community where they work. What is considered excellent teaching is dependent on both the school culture and the dominant culture the students come from8.

Our personal set of values informs how we teach, and the set of values a school community values informs what they consider good teaching. Consequently, comparing your personal values to the lived (rather than the espoused 9) values of a school is a good way of figuring out whether you are a good fit for a school.

If you are an educator considering transitioning to a new school, here are some questions you can ask to see if your set of values will mesh well with the school’s culture.

  • What level of technology is expected in your teaching?
  • How much flexibility do educators have in selecting their curricular resources?
  • When one enters a classroom and everything is going smoothly, what does one see?
  • How does the school support students with behaviour?
  • What support exists at the school for students with special needs?
  • What supports exist for teachers?

The answer to these questions will speak to what the school values, and you can use the answers to help yourself determine if you are a good fit for the school culture.

Teacher Evaluation or Teacher Growth?

Every school I’ve worked at uses a teacher evaluation system where the primary goal is to determine if whether the teachers are doing a good job or not.

These systems typically look like goal-setting with an administrator or supervisor at the beginning of the school year, a few observations of the teacher during the year (potentially with or without feedback) and then a rubric applied to decide if the teacher needs additional support or not.

What these systems don’t normally do is connect to the professional growth of the teacher. They don’t even necessarily connect to the goals of the school. In fact, many schools don’t even have learning goals for their teachers.

In an ideal system, the learning goals of the educators are that which best support student learning, derived from a shared understanding as a community what the learning goals for students should be. Imagine a school where educators work with the community (including students) to decide on what the goals are for the school, and then decide what they will measure to see progress toward those goals, and then hold themselves and the community accountable towards reaching those goals.

Instead of a system designed to play “gotcha” and figure out who the bad teachers are, the system would be designed to benefit the learning of everyone.

Teachers could select professional development that connected directly to school improvement goals. They could then see why they are learning something because those goals would be transparent to them. They would know what to focus on during professional development and be much more likely to integrate it into their daily work. Supervisors and administrators could come observe classes and be able to know what to look for and what to focus on in terms of feedback. In fact, instead of being evaluators, these people could be learners alongside their teachers.

How might your school look different if everyone had a shared vision of where they were trying to go as a school and had the time to plan how to get there?

Educational Consulting Update

How can we inspire educators to do the challenging work that is required to develop and extend their practice? What role do routines play in student learning? How do we help educators focus on the right metrics for learning? What role does technology play in student learning?

Three visuals representing completing the square are matched against 2 expressions [(x + 4)² - 3 and (x + 3)² - 2] and a third blank is given for a missing expression.

I’ve created a new streamlined page for my educational consulting services on my website to help schools and educators who are looking for support answering these questions.

Check it out here: https://davidwees.com/services/

Let me know how we can work together!

Note: I am based in Hong Kong but willing to travel if needed, around my school schedule.