Education ∪ Math ∪ Technology

Month: September 2026 (page 1 of 1)

Open Source Middle Years Programme Curriculum

A few years ago when I worked for New Visions for Public Schools, we created an open-source curriculum to support teachers with understanding and implementing some of the instructional and curriculum shifts the Common Core standards required. 8 years later, that curriculum was the 6th most popular curriculum in US high schools, with nearly 6% of high schools surveyed indicated they were using it. The leading curriculum in the US only had 6.8% of schools reporting usage. At this point, this curriculum no longer had a public website and had to be shared person to person in Google Drive.

Why was this curriculum so popular? It has features similar to the Illustrative Mathematics curriculum but that’s hardly unique. The curriculum we wrote wasn’t even totally complete as there was many gaps in content coverage in the Geometry and Algebra II courses.

My suspicion is that our curriculum was popular for three reasons. First, we were a solid and coherent curriculum and not just a collection of random resources. Second, we had designed flexibility and formative assessment into the curriculum. Instead of providing a single pathway for teachers, we provided a set of core resources and supplemental resources to allow teachers to “choose their own adventure”. Finally, and probably most importantly, we provided our resources in a format that can be edited and included a license that allowed edits. So many other curricular resources are locked in PDFs that cannot be edited and in some cases, cannot even be printed.

What I’m working on

I’ve been working on a project to develop a set of similar structured and free, open -source curriculum for the IB Middle Years Programme, aligned to the AERO international math standards. The goal is to provide a curriculum that educators can modify and adapt to meet their local needs by default. Where I will make a return on my time investment is by providing professional learning and adaptation services related to this curriculum to schools.

So far I have created a visual representing the connections between AERO Math standards, and grouped those standards into units for each course (Year 1 through Year 5). For each unit, I have broken the units into big ideas, representing a week’s worth of instruction, and broken those big ideas into daily goals, both carefully aligned to the standards themselves. Everything lives in Google Docs and is carefully linked and organized. My next step is to write assessments aligned to the MYP criteria (Knowing and Understanding, Communicating, Investigating patterns, and Applying mathematics in real-life contexts). Once I have the content in place, I will then layer in the key concepts, global contexts, and approaches to learning (and probably iterate on some of the assessments as a result).

The plan for licensing this work is to use a Creative Commons, Attribution Required, Non-Commercial Share-Alike license. This will allow educators to make changes and share those changes with others, but not to post the resources on Teacher’s Pay Teachers or create a paywall preventing access to the curriculum.

A call for contributors

If we look at other open source projects though, they benefit from collaboration from other educators. I’m putting out a call to all IB Middle Years Programme educators who would like to contribute to this project. Contributions can be small, such as testing out resources pre-publication, to being full editors and curriculum authors.

Contributors will get acknowledgement of their contributions, and with sufficient contribution, licensing agreements can be made to allow for authors to provide “add-on” services on top of the curriculum (such as consulting or curriculum adaptation services for schools).

If you are interested in contributing to this project or have ideas on how to make it better, feel free to contact me privately or leave a comment on this post. Everyone who expresses interest will be put on an email list, with the ability to leave any time.
The Purpose of Assessment

Which assessment results are better for classroom instruction? Which assessment results are better for the end of a course?

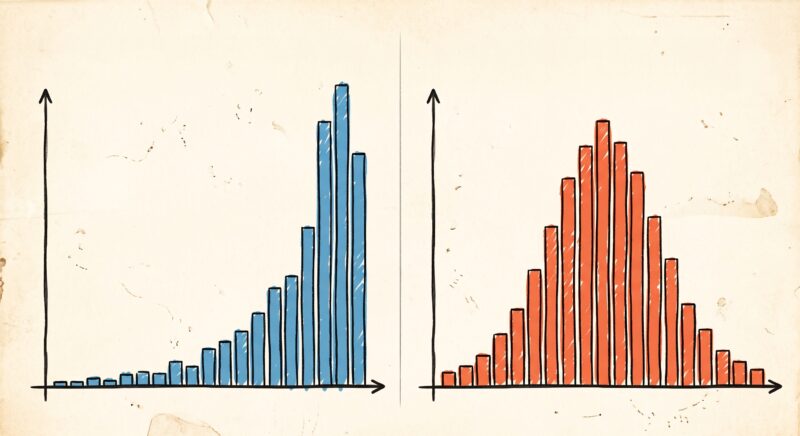
This image shows two histograms. One is heavily skewed to the left, with almost all the data at the top-end of the scale. The other is a normal distribution with the mean roughly in the middle and all the data visible.

Most people prefer the results on the left. It means the class is doing well, relative to the assessment. That’s great! The problem with it as a classroom assessment though is that there are bunch of students that we don’t know what else they are capable of doing. By contrast, the results on the right mean that, relative to the assessment, half the students are failing! That seems awful, but as information to the teacher, it’s incredibly valuable. There is no lost information in the assessment about what children know or don’t know.

What about these results?

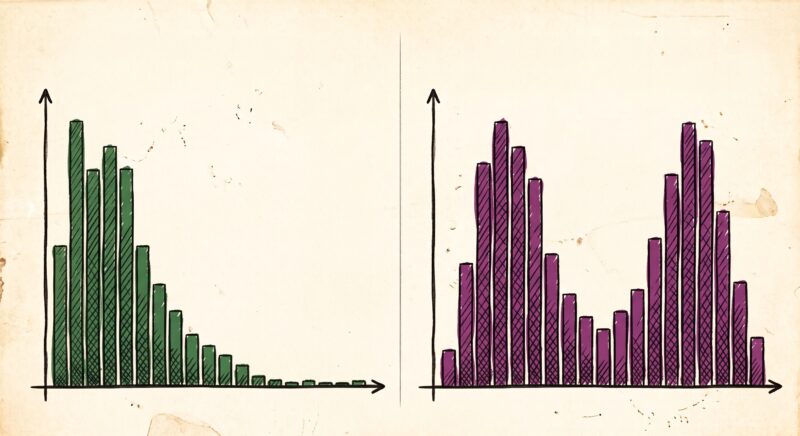
This image shows two histograms. One is heavily skewed to the right, with almost all the data at the bottom-end of the scale. The other is a bi-modal distribution with the mean roughly in the middle and all the data visible. The two modes of the data are split, with one on the lower end and one on the upper end.

Everyone agrees that the results on the left are not good, but for different reasons. When we get results like that it means not only did the children not do well, relative to the assessment, but that there are a bunch of children where we don’t know what else they might not know. The lower end of the scale is hidden to the observer. However, if the goal is to find really brilliant people who can achieve high results even on a very challenging assessment, then these results are perfect.

Similarly, the results on the right are also challenging, because what do you do instructionally? Should you reteach everyone, even though many students clearly have significant understanding?

What informs which graph we prefer to see is our goals for the assessment. When we design assessments, we need to keep our goals in mind.

For classroom assessments designed to find out what students know about a topic, we ideally want every student to experience some success on the assessment and we want no student to be able to complete all of the assessment accurately.

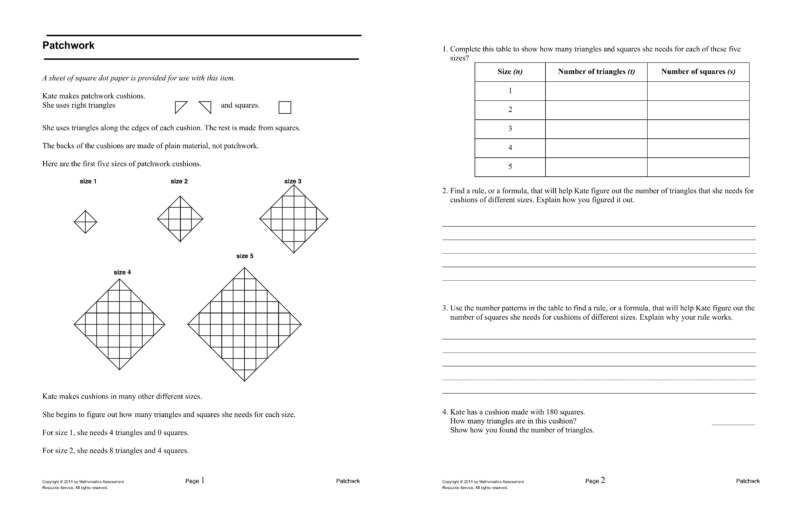
Here’s an assessment from the Mathematics Assessment Project which aims to achieve this goal: learning what all students understand about building a function that models a relationship between two quantities.

The image shows two pages of an ramped assessment task, where each problem gets progressively more challenging, but where the first problem should be doable by all students.

How these tasks work is the task is ramped, which means that ideally all students are able to start the task, and then eventually almost all students run into knowledge and skills they don’t know how to do. This increases the instructional value of the assessment.

For assessments designed to rank and evaluate students according to how well they understand a course, and then report overall results back to the learner, we want results that favour most students passing.

Since many classroom assessments that inform instruction are also used to rank and evaluate students, we run into a challenge where the ideal results to inform instruction look terribly to parents and students trying to understand how well they are doing.

A solution to this problem is to keep two sets of data for each major assessment. One set of data is intended to inform instruction and the other is to help parents and students see how well they are progressing in a course. Since the first set of data is intended to inform instruction, the ideal form of those data is descriptive information about what learners know and what strategies they use. The second set of data can be generated from an assessment by using a rubric or scale that takes the results and scales them to whatever level of achievement is normative at the school. This way one assessment can achieve both aims. It can be challenging and tell the teacher what children know and don’t know and it can help parents and students see growth and good performance.

The main ideas are that the form of our assessment should be informed by the goals of that assessment and that it is possible to use an assessment in more than one way, depending on how we report the results to students and parents.