Which assessment results are better for classroom instruction? Which assessment results are better for the end of a course?
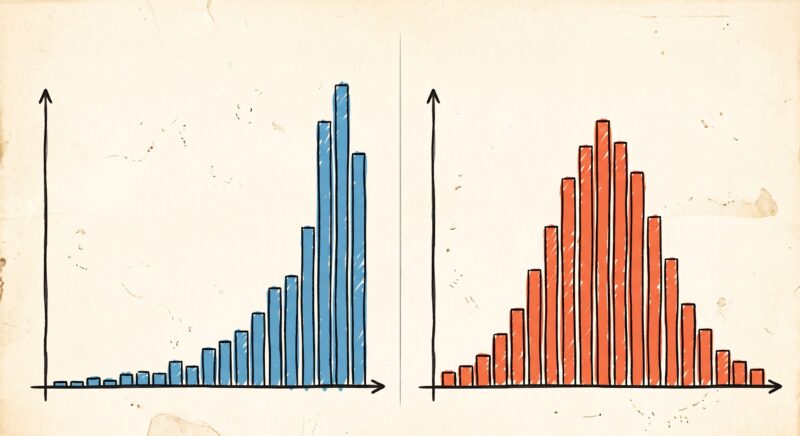
Most people prefer the results on the left. It means the class is doing well, relative to the assessment. That’s great! The problem with it as a classroom assessment though is that there are bunch of students that we don’t know what else they are capable of doing. By contrast, the results on the right mean that, relative to the assessment, half the students are failing! That seems awful, but as information to the teacher, it’s incredibly valuable. There is no lost information in the assessment about what children know or don’t know.
What about these results?
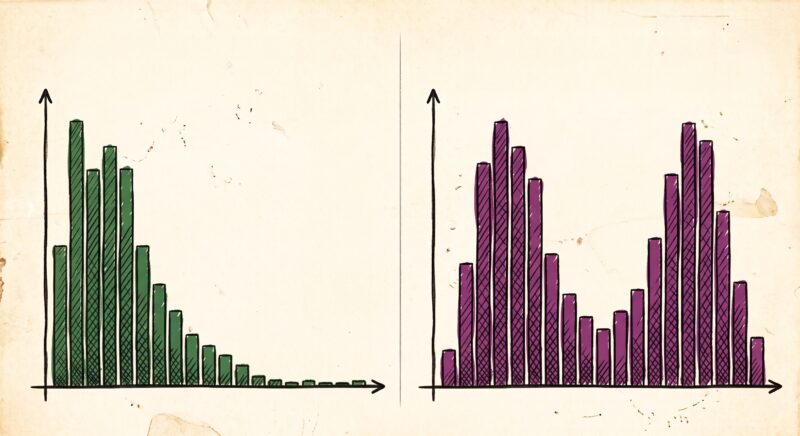
Everyone agrees that the results on the left are not good, but for different reasons. When we get results like that it means not only did the children not do well, relative to the assessment, but that there are a bunch of children where we don’t know what else they might not know. The lower end of the scale is hidden to the observer. However, if the goal is to find really brilliant people who can achieve high results even on a very challenging assessment, then these results are perfect.
Similarly, the results on the right are also challenging, because what do you do instructionally? Should you reteach everyone, even though many students clearly have significant understanding?
What informs which graph we prefer to see is our goals for the assessment. When we design assessments, we need to keep our goals in mind.
For classroom assessments designed to find out what students know about a topic, we ideally want every student to experience some success on the assessment and we want no student to be able to complete all of the assessment accurately.
Here’s an assessment from the Mathematics Assessment Project which aims to achieve this goal: learning what all students understand about building a function that models a relationship between two quantities.
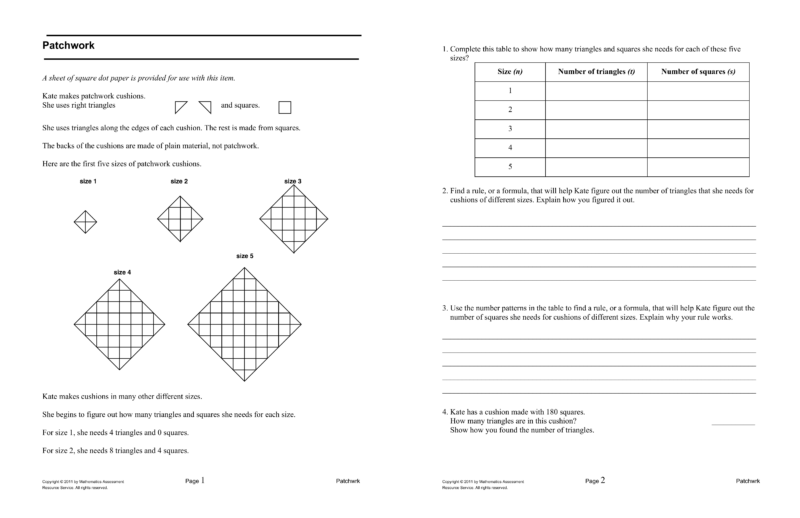
How these tasks work is the task is ramped, which means that ideally all students are able to start the task, and then eventually almost all students run into knowledge and skills they don’t know how to do. This increases the instructional value of the assessment.
For assessments designed to rank and evaluate students according to how well they understand a course, and then report overall results back to the learner, we want results that favour most students passing.
Since many classroom assessments that inform instruction are also used to rank and evaluate students, we run into a challenge where the ideal results to inform instruction look terribly to parents and students trying to understand how well they are doing.
A solution to this problem is to keep two sets of data for each major assessment. One set of data is intended to inform instruction and the other is to help parents and students see how well they are progressing in a course. Since the first set of data is intended to inform instruction, the ideal form of those data is descriptive information about what learners know and what strategies they use. The second set of data can be generated from an assessment by using a rubric or scale that takes the results and scales them to whatever level of achievement is normative at the school. This way one assessment can achieve both aims. It can be challenging and tell the teacher what children know and don’t know and it can help parents and students see growth and good performance.
The main ideas are that the form of our assessment should be informed by the goals of that assessment and that it is possible to use an assessment in more than one way, depending on how we report the results to students and parents.

Nora says:
Most of the standardized assessments do not provide timely information or useful information. The other issue is that when the scores are shared with teachers, etc, months and months have passed.
If our goal is to know what the children have mastered and where they are struggling, we have to rely more on formative assessments to guide our teaching, rather the standardized assessment, which really show the gross differences and are used for ranking schools while ignoring the context characteristics of populations across the country.
September 4, 2026 — 1:26 pm