Act One
Show this video. Ask students what questions they have.
Act Two
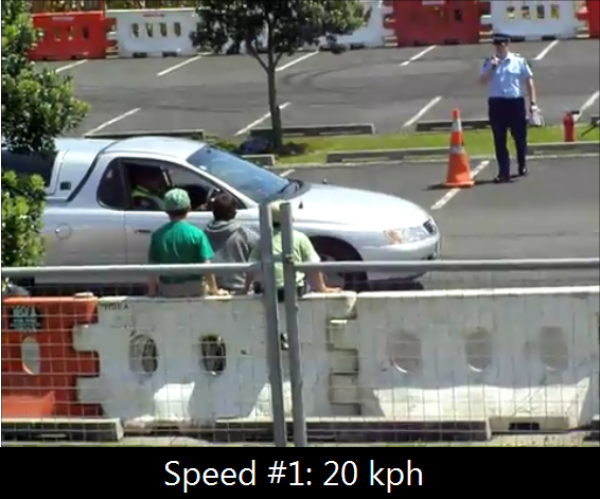
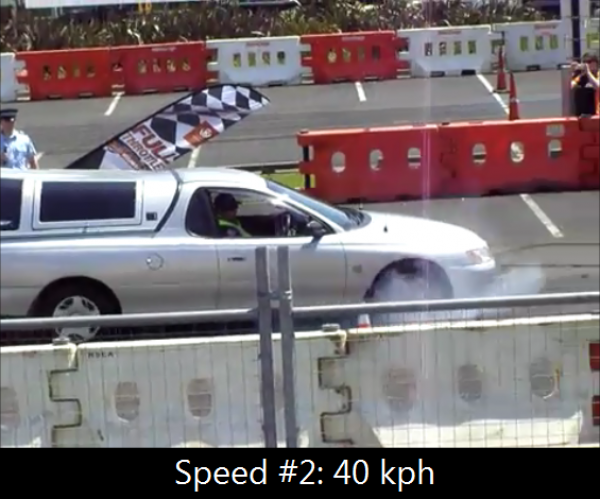
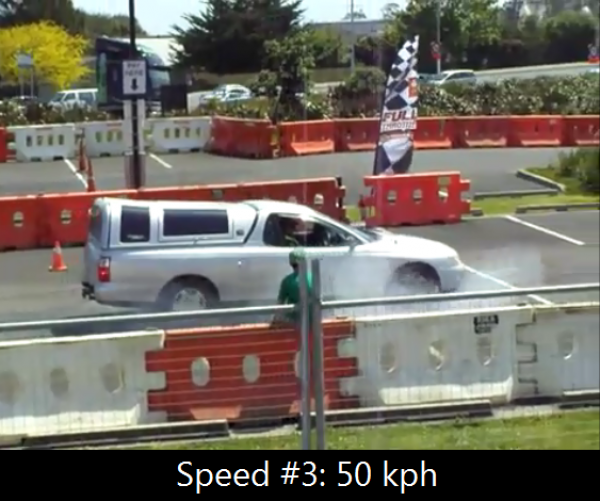
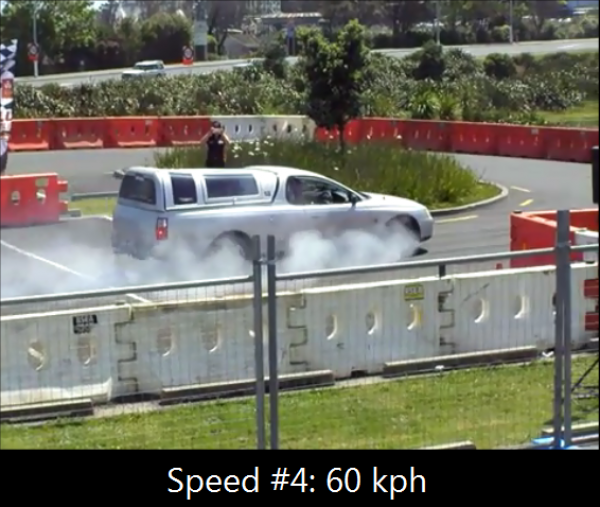
Give the students these photos. From these they should be able to figure out the distances travelled by the car, but you may wan to point out those handy reference points in the background (hint: the parking spots).
Act 3
I don’t know exactly what Act 3 should look like. Would a graph make the most sense? A function in standard form? Would an image overlay of the car in all four positions work the best (I don’t have the tools to make this on my current computer)?
Dvora G says:
My first thought was where are the brakes starting to be applied and then how hard it was to count the number of spaces while the video played especially as the car gets faster and the trees are in the way. I had to play the video many times to count the slowest speed one. Are parking spaces a standard width?
Now that I think more, my question from the video might actually be how fast are they going and you might want to think about alternative sets of Act 2 data depending on the question the students ask and decide on answering.
I like the idea of a graph for Act 3 especially if it can somehow overlay the video like a graphing story. This could answer either a question about distance or time.
July 23, 2013 — 2:29 pm
David Wees says:
It would probably help if I could get a better video to work with. This is the one I found had at least 4 data points after several minutes of searching. Maybe there is a good video I can remix out there with at least 4 data points, AND which is also much easier to see the important data in.
Another possibility is to split this video into 4 parts, and slow down this video for students, perhaps to 1/4 speed or so to make data collection from the video easier.
July 23, 2013 — 10:03 pm
Dan Meyer says:
Hi David, my question here is what is lost and what is gained by asking students to derive their data from the video as opposed to just giving them the data after they decide they need it?
July 24, 2013 — 10:38 am
David Wees says:
I see a gain in the sense that students have to take the idea of measurement and scale or proportional reasoning, and use it in the context of a problem that has a bigger goal. This has two benefits; they need to look at and remember mathematics that they learned in earlier years, and they may see that mathematics has connections in many areas that they didn’t know about.
The most obvious drawback is that it makes the problem more complicated and widens the focus of the problem from just being a modelling problem, to being a problem where they have to apply previous knowledge (which they may not have!). Their cognitive load when solving this problem will probably be higher, and for some students this may push them over the limits of their working memory.
It would however allow a teacher, who I assume would be walking around the room observing students, to see that some of his/her students are struggling with the proportional reasoning. If I’m an algebra teacher, I’d like to know that, because it is something that is important to address.
July 24, 2013 — 1:37 pm