Education ∪ Math ∪ Technology

Year: 2015 (page 2 of 3)

Fractions are hard

Fractions are hard. Of course, I knew this before my lesson on Saturday, but the responses of my students to a task really drilled that point home for me.

Here is the activity I gave my students to do:

assignment-for-students

Here’s what I anticipated they might do:

anticipating-student-work

Here’s a sample of what they actually did:

Student 1
student1-1
student1-2

This student seems to understand that if you want to shade 1/4 of something, you want to split it into four equal parts and then shade one of those parts. The triangle drawn is more challenging to divide, so the student likely estimated their partitioning of it.

However, if one wants to shade 1/3 of an object, it looks like this student thinks that they need to split the shape into four unequal parts and shade the smallest of those parts, maybe because they think that 1/3 is smaller than 1/4?

Student 2
student2-1
student2-2

This student told me that they know that 1/4 is the same as “half of a half” and so they divided each of the shapes in half, and then divided one of those halves into a further half, and then shaded it.

When it came to shading 1/3 of a shape though, this student looks like they divided the shape into four equal parts and then shaded three of those parts. My guess is that they thought that fractions involve dividing into four parts, and then used the denominator of the fraction to choose how much to shade? I’m not sure that they noticed the inconsistency in this procedure and what they did in the first part.

Student 3
student4-1
student4-2

This last student seems to have done pretty much the same as the second student, but seems aware that when you want to shade 1/3 of a shape, you want to first divide it into three equal parts and then shade one of those parts. I asked them about it and they said they just weren’t sure how to cut the shapes into three equal parts.

With this gap between what I was expecting to see and what I actually saw, I was left without knowing an effective way to respond. I decided that this task had little entry points for someone who really did not know what 1/4 and 1/3 meant (one of my student’s work was blank, which I am not showing since I do not have permission).

With the worry in the back of my head that I was probably reducing the cognitive demand for students, we split into two groups with my student-teacher leading one group and me leading the other group and we tried a different task, one which offered some context through which one might make sense of what 1/3 means.

“If you had a pizza and you wanted to share it equally with three people, how would you cut it up so that each person got 1/3 of the pizza?”

With this prompt, students in my group almost all produced work similar to the following:

revision_of_work1

With one student drawing this:

revision_of_work2

This second student, by the way, said that pizza comes cut into ten-slices and so the best we could hope to do is to give each person 3 slices of the 10 and then give away the last slice to someone else.

The knowledge that would have helped me better anticipate student understandings here is what I call “the ways children typically understand mathematical ideas” and is the kind of knowledge that is rarely explicitly taught before starting teaching. Every time I teach a new topic, I notice that the ways students think about the ideas are different than what I expect, and over time, I learn to anticipate student thinking better as I get feedback from working with them.

If you had students showing these kinds of responses to this task, what would you do during your next lesson on fractions to support them?


Looking at student data

Almost every school district across the United States is thinking about how they use data to inform instruction. Not all of them are doing so in ways that I think are likely to lead to useful change.

Below is an example of the kind of data that has no useful impact on instruction ever. The data content in the picture below is high but the information content is low. How exactly is this information supposed to help a teacher make sense of what she should do with her students?

Spreadsheet

Here’s a slightly more useful variation on the same data where it has been organized to potentially be suggest some next steps. However, there’s a critical piece missing in this data – the actual task students did! Without knowing what the questions were that were asked and without knowing what the responses below refer to, this is meaningless information. The only take-away that I have from the information below is that it is unlikely for these multiple-choice questions that students were guessing.

Item analysis

This leads me to believe that one of the issues we have with this data is that it has compressed the information about what students did to such a great degree that it is impossible to use the information meaningfully. All of the rich work students have done and what they have thought about has been compressed into a few numbers and consequently making decisions based on those numbers alone is incredibly difficult.

Information Compression of Scoring

What can we do differently? One option is to consider hypotheses about why students may have actually chosen those multiple choice responses like the following. Again, the question itself is critical but at least this leads to some potential things to give feedback to students about.

Multiple choice reasoning

But these suggestions for what students thought about if they chose a response are just hypotheses. They are thought through from an adult’s perspective on the mathematics and these kind of analyses are rarely informed by detailed and thoughtful research into children’s mathematical thinking.

While multiple-choice questions are an inexpensive and relatively time-efficient way to gather evidence of student performance, they make it difficult to really capture the richness of student thinking. What, for example, do you think the student below was thinking about when they worked on this problem?

Student work

While it is clear that this sample of student work provides potentially powerful information, the challenge with looking at individual student work is it can be extremely time-consuming and challenging to study a variety of student work and come up with systematic responses to that group of students. We have to somehow combine the richness of information provided by what students actually did with a systematic approach so that we can approach teaching an entire classroom full of students.

One approach we have used in our project to diagnostic assessment is to systematically look at student work and decide what approaches students took and attempt to group their work with other students who appear to have thought similarly. A teacher I know literally uses the desks in his classroom and spreads out all of his student work across the room trying to make sense of the different mathematical ideas students used. Other teachers record their interpretations of the approaches the students used in spreadsheets, like the picture below suggests.

Student strategies

But still, no matter how we organize the information, the question remains, what do we do with it? A further challenge is, how do we use information on what we uncover about student thinking in a more timely fashion rather than after our class is over?

I’m going to suggest some approaches for both of these questions in a follow-up post, but I’d love to know how you respond to student data, both after the fact and during a class.


Choral Counting

Record of choral counting

Last Saturday, I tried a new instructional activity called Choral Counting. This activity was recommended to me by Magdalene Lampert and comes out of the work she and others have done to support high-quality ambitious teaching.

I’m experimenting with these instructional routines in part because I hope to support teachers in the project I support in using them in their instruction, which I can hardly be expected to do without experiencing them from the inside myself. It’s clear that this activity is much richer mathematically than one might expect from just hearing about it. One finding I have already is that I have to do a much better job of planning how I will use my space when recording the numbers!

The basic idea of choral counting is easy — students count in unison and you write down the numbers as they chant, and then pause students to ask them questions about the numbers. What I learned Saturday is that there is a lot of potential in this activity to bring out rich mathematical ideas for discussion as a group.

I chose to start at sixteen and count by fives. While the counting was going on, I noticed my students paused a bit at 76. So I stopped and asked them why they think they paused. They also paused at 101, which during my lesson planning I had anticipated they would do. They also had different responses at 111 (121 was next, which I expected).

I don’t know why they found 76 more challenging. Maybe because it was the first time they had to use a number in either position higher than 6? 101 is clear – Many students thought “tendy one” and self-corrected before they spoke, which slowed them down. I thought this myself when I first counted through this routine! Many students said 121 instead of 111 and I remember my own son doing something similar when he was learning how to count.  I also paused a couple of times to ask students what pattern they noticed and at one point I asked them to predict what the number would be if we counted four more times. One student proved her answer by counting up by fives, another student said it would be twenty more because four times five is twenty.

Here’s the data collected by my assistant teacher (one of the children’s older sister comes to the class and she has happily volunteered to record information for me and to walk around the class generally supporting students).
Choral Counting

Once we got to 131, I asked students what would be the next number that starts with 2. Two students came up with different mathematical arguments that the next number would be 201. One student said that the first digit was clearly a 2 and that the next digit must be a zero, because we are counting by fives. The last digit must be a 1 because our pattern always alternates between 1 and 6 and 1 is smaller than 6. The other student said that if we counted 19 fives or 95 higher from 101, that would be 196 which does not start with 2, but that if we counted 20 fives or 100 higher from 101, that would be 201 which must be the next number starting with 2 since we won’t count a number between 196 and 201.

Although the activity went longer than I expected, it was incredibly rich and worth doing.


Treating Teachers Like Sense-Makers

Your workshop was so interesting. I learned so much!” ~ An actual comment from a participant in one of my workshops yesterday.

Too often we ask teachers to listen for an hour or even two to someone talk nearly non-stop about what they know with perhaps a question thrown in once in a while. Since very few people can talk in an engaging way for this amount of time, it’s no wonder that so many people check out of this kind of experience.

But this experience is even worse because most educators have the background experience to engage in the ideas being discussed almost immediately but lecturing at teachers does not take into account their prior experiences. If someone lectures at teachers for an hour, I assume that they actually do not understand their topic or teaching well enough to think through how someone might engage in the topic more directly (the only exceptions are a keynote or a class size that numbers in the hundreds, very little else is possible without technology).

Yesterday I gave teachers a very brief introduction to one of four potential technology tools they might want to explore, and then I gave them access to the resources they would need to explore the tools. While they did this, I circulated around the room. Once it looked like they had made a decision about which tool they intended to explore more deeply, I asked them to group up with people exploring the same tool.

Then I continued to circulate around the room and made a note who seemed comfortable with the technology, who needed support, and who was vocal and who was not. I checked out who attempted to make things with the tools for themselves and who seemed more content to explore things already created. I used the information I gathered to decide when to pause the various groups’ discussion and work and how to structure the ensuing conversation and what questions might be useful to ask. I used the experiences the teachers were developing from the technology to inform the rest of the session.

photo-sample-blockly-program-small

A program written by a participant


I asked teachers to try and fill in a lesson plan template and choose a goal. Most did not, and so I decided to model a potential use of the technology using a Noticing and Wondering protocol. We then discussed what goal this activity might support and what this activity would look like if we tried to use pencil and paper.

At no point did I treat the teachers like they were incapable of figuring out how to use the technology themselves or thinking through for themselves how the technology might support their teaching. I certainly gave them opportunities for feedback on their ideas and offered them support when they seemed to need it, but I treated them as people who think and the ideas they had as being important to surface.

After all, this is all just good teaching, and don’t educators deserve that?


Creating a Formative Assessment Tool in Google Spreadsheets

In the project I’m involved in, teachers are expected to give students a beginning of unit performance assessment task both to preview the mathematics of the upcoming unit for students but also to give teachers a sense of how students understand some of the mathematical ideas from the unit. The tasks themselves are drawn from the MARS tasks available through our partnership with the Silicon Valley Math Initiative.

At the beginning of the year, we made two major shifts in our beginning of unit diagnostic assessments. The first is that we selected tasks which aligned more closely to mathematical ideas that one might consider pre-requisite ideas for the unit. The next is that we developed a more sophisticated protocol for teachers to make sense of the student work.

lookingatstudentstrategies

In prior years, we expected teachers to use a rubric to score the student work and use the scores to make decisions about what to do next. Unfortunately this process has teachers compress the information from the student work into  a single number for each student, and then we had to provide a tool to help teachers unpack the score into mathematical understandings and then have them decide on next steps. This means that a huge amount of potentially useful information for making decisions about the student work is lost in the conversion to a number which unnecessarily complicates the decision-making process.

Information Compression of Scoring

Instead, we developed a protocol and a spreadsheet tool so that teachers could look at the student work and systematically record the strategies the students were using as well as how successfully students used these strategies.

In order to develop the protocol and the spreadsheet tool, I took a sample of student work on the task and grouped it according to different types of mathematical strategies students used for each question on the task. I then decided on language that would communicate those strategies to teachers and created a set of instructions on how to go through the student work and record the strategies systematically.

Given the amount of time this takes, we decided to restrict this to just the beginning of unit assessments and suggested to teachers that instead of looking at every single student’s work, they could select a random sample of 20 to 30 students to look at in depth. We also attempted to make it clear, that while we strongly suggested that teachers try using this tool, this was not a mandated part of our project; instead the mandate is for teachers to give an initial assessment to their students and then systematically make sense of the information provided by the task.

Once we have the spreadsheet tool ready for any given unit, our data researcher uses Autocrat and a custom script a member of the New Vision Cloudlab team wrote to distribute the spreadsheets to teachers and then pre-populate the spreadsheets with their student names.

One theory I have with this work is that an excellent way for teachers to develop their knowledge of how students approach mathematical tasks and consequently understand mathematical ideas, is to systematically look at student work and record and analyze the actual strategies students have used, as represented by their written work.

An interesting finding we have so far is that although not all of our teachers are using the spreadsheet tool, many of them are systematically sorting their student work by different strategies used and making sense of the student work and then deciding on instructional next steps, based directly on the student work itself. This is very likely an idea generated by the use of the tool as we had not witnessed large number of teachers in our project using this protocol until this year.

Our hope is that by the end of this year, we will have tasks and tools available for each of the twenty units we are developing as part of our resource support for teachers.


Thinking Through a Lesson

Today I’m working with a team of technical support personnel, who are not educators, and introducing some ideas they can use to help support teachers in their use of technology. I was reminded this morning of the Thinking Through a Lesson Protocol (TTAL) developed by Peg Smith, Victoria Bill, and Elizabeth Hughes it occurred to me that this is the kind of tool that could be useful for educators to use when planning lessons to decide if they should have a technology component (and for educational technologists to recommend to teachers to use when planning lessons involving technology).

Whenever I plan a lesson, I look for the coolest technology first.

In my experience when I first started using technology in my teaching, my planning protocol went something like this:

  1. Find some cool gadget or activity and say “Oooo, I have to use this.”
  2. Shoe-horn it into a lesson even if it didn’t always make sense.
  3. Wonder why my students didn’t learn a whole lot from the activity.


The advantage of the TTAL protocol is that it puts the goal or focus first and helps prompt someone planning a lesson to think through how each part of their lesson supports their overall goals for students. I also think that although the TTAL protocol was originally developed for use developing lessons with a mathematical focus, it could be fairly easily adapted to be more content-agnostic.

The overall protocol goes something like this:

  1. Set up and select a task based on your goal.
  2. Support students doing the task.
  3. Share and discuss the task.

I recommend reading the entire protocol because there is obviously more nuance to the protocol than what I am describing. For example, the TTAL protocol recommends that you do the activity you are planning for students to do, both how you would do it with your knowledge and experience but also to anticipate how your students would do the task with their different knowledge and experience.

A critical idea to keep in mind when making choices about activities for lessons, including ones that involve technology; what your students think about is what they will remember and what they remember will dictate what they will be able to do.


Mistake-making to sense-making

Here are my slides and my notes from my five minute Pecha Kucha-style presentation at Educon. The focus of my presentation was on my journey as someone who started his teaching as viewing students as mistake makers to being a teacher who views students as sense-makers.

  1. I’m going to talk today about my journey from a teacher who tried to correct students’ mistakes to someone who paid attention to student thinking and participated in mathematical reasoning with my students.

  2. When I first started teaching, I monitored students’ behaviour, carefully recording dots when they failed to hand in their homework, dots when they were late, dots when they did not participate, dots when they were absent. I held those dots over my students’ heads like the Sword of Damocles. I was the dot master!

  3. I noticed that my students made predictable mistakes and I modified my lessons to address those mistakes. “Don’t forget to change the sign of the second number.” “x times x is x-squared, not 2x.” “Don’t cancel the x’s!”

  4. However, I was often confused by what they were doing. I became curious about where student mistakes come from. Why is this student writing a +1 there? What does this mean to him? Why are students doing these crazy things??

  5. I began to realize that what students said and what they did was the result of something they were doing that I could not directly observe. I formed a hypothesis: students think. In fact, I realized that students think quite a lot.

  6. I thought my job was to intervene on how they were thinking rather the product of that thinking. I realized that if what students do is a product of their thinking then I need to know what they are thinking not just what they write. I needed to be able to read minds.

  7. Unfortunately, I still thought my job was to fix their thinking as if it were something that had been broken by their experiences. I thought that my students were just thinking wrong things, and therefore all I had to do was correct their thinking.

  8. “A teacher is a mechanic for the mind”, I said to myself, “And in order to repair it, I just need to know how it works.” I wanted to reach into my students’ minds and fix them. I viewed my students as broken and my job was to make them whole again.

  9. I listened to what my students said. I carefully watched what my students did to help me prognosticate their actions. “If I just know enough about how they think,” I thought, “I can help them think better.”

  10. I was judge, I was jury, and I executed based on my understanding of student thinking. I tried students for the crime of thinking differently than I and sentenced them to more explanations of the only truth that mattered, my truth.

  11. This approach has flaws. It has limitations. 10 thoughts per kid. 20 kids a class. Six classes a day. Five days in a week. 34 school weeks in a year. That’s 204 thousand thoughts a year to pay attention to. It was overwhelming.

    Screen Shot 2015-04-20 at 6.09.09 AM

  12. And you know what? One day I realized that the way the kids thought yesterday wasn’t the same they thought today. What I learned about student thinking was out of date by the time I wanted to use it because, just like me, kids don’t think the same way everyday.

  13. I needed to be able to responded to thinking live in the moment, rather than teaching while blindfolded. I started having mathematical conversations in the moment with my students and listening to them have conversations in order to uncover their thinking and respond now.

  14. I anticipated student thinking instead of student mistakes. Here’s 11 different ways I solved a problem. Guess how many of these ways were actually used by my students? None of them. Human cognition is incredibly complex.

  15. I questioned my beliefs about mathematics and why we teach it. What do I want my students to get out of mathematics class? More importantly, what do my students want to get out of mathematics class?

  16. We are conditioned to think of ideas like this as being right or wrong, correct or incorrect, true or false. Instead, let’s figure out how what this kid has done make sense to her. Let’s remember that that students’ mistakes are the result of thinking.

  17. There are other benefits to making student thinking visible in a classroom. An ongoing mathematically-rich conversation engages all of my students in thinking about mathematics in ways which give them agency and authority.

  18. How do we design mathematics classes where students don’t end up thinking they’ve spent 13 years memorizing arcane rituals? Let’s make mathematics class about learning about thinking rather than about trying to avoid mistakes.

  19. Children are not broken! It is not our job to treat them as things to fix. Children are sense-makers! Our job as educators is to provide experiences so students develop models for understanding the world.

  20. Here are my sons. Let’s work together to build a world that treats them and all other children as sense-makers within it.

Academic Language in the Math Classroom

Here, go and read through this task from Illustrative Mathematics. I’ll wait for you. Pay attention to the use of academic language in the task.


Here are the academic vocabulary words I noticed students would need to understand (in an academic sense) in order to be able to do this task without any support:

table, random, data, scatterplot, selected, relationship, linear, equation, least squares regression, line, interpret, points, variability, estimate, expect, more than, less than, predicted, amount, more, less, residual, difference, calculated, plotted, corresponding, number, set, explain, determine, appropriate, describe, sample, diameter, plot, fit, area

Students might not know some of these words and still be successful task as they can use the other words (including the non-academic vocabulary) in order to make sense of what those words mean. It could also be that through doing this task and talking with other students about it, they can learn some of the words that they did not know.

All of these words are important words for students to know and to be able to use in appropriate contexts if students are going to be able to participate in the wider mathematics community. We cannot strip language, either common or academic, from our mathematics classes and expect students to be successful. As Harold Asturias has reminded me a few times, in order to have complex ideas, we need complex language to describe those ideas.

On the other hand, we can be thoughtful and deliberate in how we introduce new words to describe ideas to students. Specifically we can:

  • When students describe an idea but do not use the language a mathematician might to describe it, you can revoice their idea (or other students can) using the language that a mathematician might use, being careful not to introduce so many new words that students cannot piece together what each of them means.
  • You can use mathematical problems with sufficient text for students to make sense of the mathematics and to use the context to make sense of the new words to which they are being introduced. Again, words should be introduced strategically because a page full of words students don’t know will sound like gibberish to them.
  • You can introduce words through multiple contexts including text, words, visualizations, mathematical problems. This way students can make sense of what the word sounds like, would be used in a sentence, would look like if drawn, and how it applies to mathematical ideas.
  • You can use the mathematical practices to situate the language students need to learn within the context of the problems they are trying to solve.


What else can we do to help students use language to make sense of mathematical ideas?


Formative Assessment: More than just an exit ticket

As part of homeschooling my son, I recently started teaching a mathematics class to a group of 8 to 10 year olds on Saturday. In this class, I decided to use the TERC investigations curriculum. After reading through the curriculum overview, I decided that the major focus of the first unit of each year is about helping students preview the mathematics to be learned for the year and investigating as a teacher what students currently understand. 

The very first investigation for grade 3 is on counting out 100 snap blocks. In this task, students are prompted to explain how they are sure they have 100 snap blocks. The goals of the task are to investigate how students understand numbers represented in a visual way and to learn how they communicate mathematical ideas to each other orally as well as in writing.

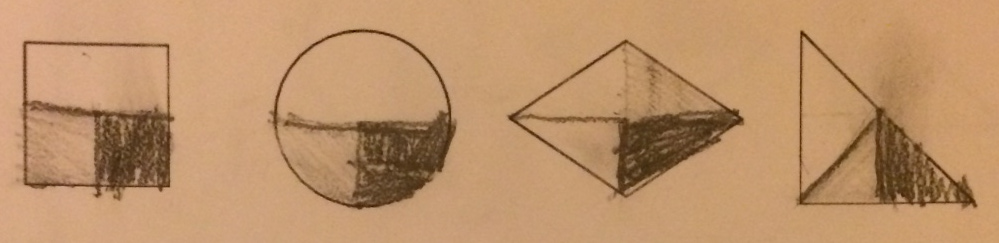
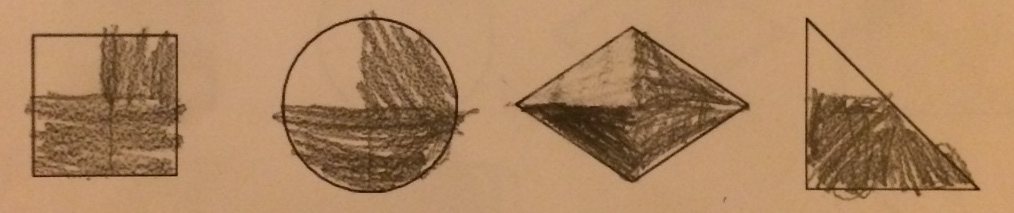
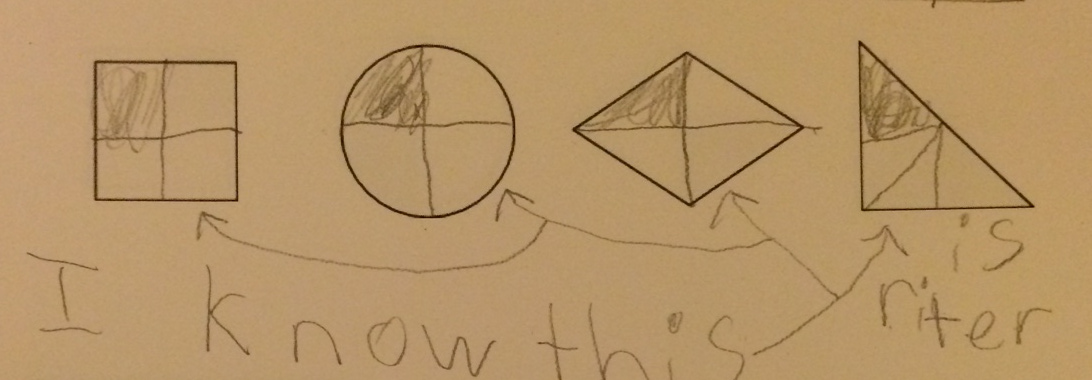
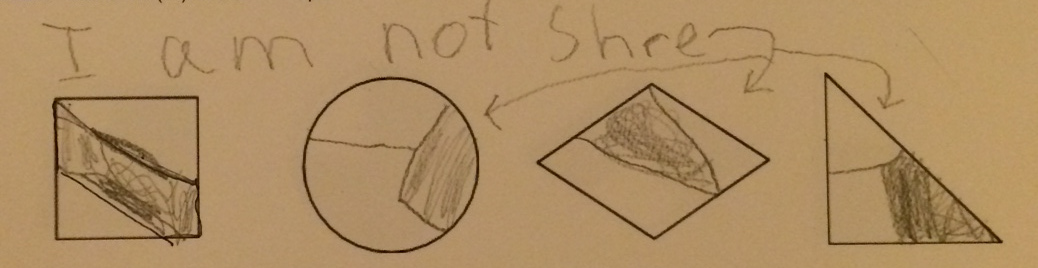
Before I decided to use the task with students, I decided to try a few different strategies myself to try and anticipate what strategies students might use. Here are a few of them below.

1/1/15 - 11

1/1/15 - 9

1/1/15 - 10

1/1/15 - 8

1/1/15 - 7

1/1/15 - 6

1/1/15 - 5

IMG_2534.JPG

IMG_2533.JPG

IMG_2532.JPG

IMG_2530.JPG


As it turned out, only one of these strategies was actually used by students in the class. I uncovered this, while students were working on this task, by circulating between groups and looking to see what students were actually doing.

One group started with a 5 by 5 square they had already built during the free exploration time, and built out into a 10 by 10 square. As it turns out, I built my 10 by 10 square by snapping together 10 columns of 10 blocks so even this very similar strategy did not exactly match my thinking. This group finished quite quickly and when asked to find another way of proving they had 100 blocks, did not do so. Instead they worked on improving their explanation.

Another group decided to split the task of counting in half, and realized this meant that each of them would be responsible for counting out 50 blocks. However, when they started working, they did not communicate with each other very well on their plan for counting and for the first several minutes they just put blocks together. Upon observing this, I asked them what their plan was, which required them first to communicate about a plan. One of the students decided that 50 blocks could be counted as two rows of 25 blocks, and that 25 blocks could be represented as a 5 by 5 square, and so they each individually created a 5 by 5 by 2 block, and put it together on the height 2 side, forming a 5 by 10 by 2 block.

The final group just started by snapping blocks together as quickly as they could without keeping track of how many blocks they had, but they did attempt at least to keep their blocks in a rectangular prism form. I asked them what their strategy was, and one of them indicated that they were not counting because they planned on counting later once they were pretty sure they had 100 blocks. I then decided to keep asking them how many blocks they had every time I checked in with them. Finally I asked them to stop building and just count how many blocks they had.

At this stage the students had a 5 by 5 by 4 rectangular prism. As the students counted their blocks, I noticed that they had to count the lengths of each side each time, and had to count the number of blocks on each face each time, and did not seem to be subitizing this collection of objects. I also noticed that their strategy for counting all of the blocks was to count the surface area of four sides of the whole block ending up with 20 + 20 + 25 + 25 for 90 blocks total. I wondered why they had chosen only four sides with this strategy instead of a more consistent six sides, so I asked them how many sides the block had. They counted it out by rotating the shape, found the block had six sides, and decided that in fact they must have 20 + 20 + 20 + 20 + 25 + 25 blocks.

At this point, I thought about ending the counting activity and having groups come together, but I decided that because the students did not know each other very well, and because I had not done very much work on constructing community norms around how work is shared, it would not be very productive for this group to come and present their model at this time. Instead, I pointed at one of the corner blocks asked the students how many times this one block was counted with their scheme, and one of the students quickly noticed that it would be counted three times, at which point one of the other students said, “Oh” and decided to count the blocks by “counting the groups of blocks”. He basically counted out one row of 5 by 4 to find out how many blocks were in one row and then counted out the 5 rows of blocks to come up with 20 + 20 + 20 + 20 + 20 = 100 blocks. The first student looked clearly convinced that this meant they had 100 blocks so I decided to continue to be uncertain as to whether the third student in this group was convinced and end the activity.

As the students got together, I decided to sequence their explanations from the group that counted out half of the blocks, the group that counted out the big rectangular prism, and end with the group that counted out a 10 by 10 square. Each group shared their strategies while I prompted them to explain their work more completely.

After the class was over, I took time to write notes to myself on what I noticed during the class, to help me plan the class for the following week. I looked at what the students wrote down as their explanations on paper, and decided that these did not capture enough of the thinking students did to be very useful to me, except that I became acutely aware that all of my students need work constructing coherent explanations.

My goal for this group of students is to develop their capacity to use arguments and evidence to justify the mathematical ideas they uncover with each other to form a community of mathematicians. I want them to be curious about how each other understands the mathematics and to use their shared understanding to extend and build on their individual understanding of the mathematics.

The formative assessment process I used during this lesson could be summarized with the following steps:

  1. Do the mathematics myself and anticipate how students might do the task,
  2. Give the task to students to do,
  3. Observe what students actually do and what they say to each other while they work and ask questions to clarify my understanding of the strategy they are using,
  4. Intervene in the student thinking only when necessary and only when a useful intervention seems clear to me.
  5. Use my growing knowledge of how the students understand the mathematics as a basis for my decisions, both in-the-moment and to inform future work with these students.

The process I’ve described above does not require an exit ticket, it does not require different coloured cups on tables, it does not require daily quizzes. It requires me to plan what thinking I hope and expect to see and to build a model of how students understand the mathematics and to carefully select how I will support students in developing their understanding.

Formative assessment is more of a mindset on using student thinking as the basis for teaching and learning rather than a quick checklist or a list of strategies.