In the project I’m involved in, teachers are expected to give students a beginning of unit performance assessment task both to preview the mathematics of the upcoming unit for students but also to give teachers a sense of how students understand some of the mathematical ideas from the unit. The tasks themselves are drawn from the MARS tasks available through our partnership with the Silicon Valley Math Initiative.
At the beginning of the year, we made two major shifts in our beginning of unit diagnostic assessments. The first is that we selected tasks which aligned more closely to mathematical ideas that one might consider pre-requisite ideas for the unit. The next is that we developed a more sophisticated protocol for teachers to make sense of the student work.
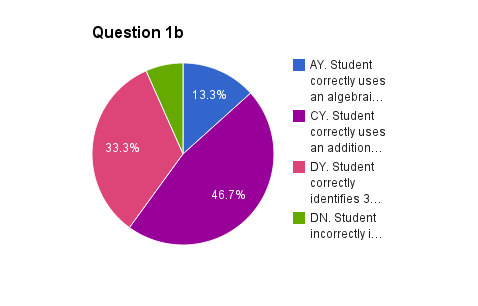
In prior years, we expected teachers to use a rubric to score the student work and use the scores to make decisions about what to do next. Unfortunately this process has teachers compress the information from the student work into a single number for each student, and then we had to provide a tool to help teachers unpack the score into mathematical understandings and then have them decide on next steps. This means that a huge amount of potentially useful information for making decisions about the student work is lost in the conversion to a number which unnecessarily complicates the decision-making process.
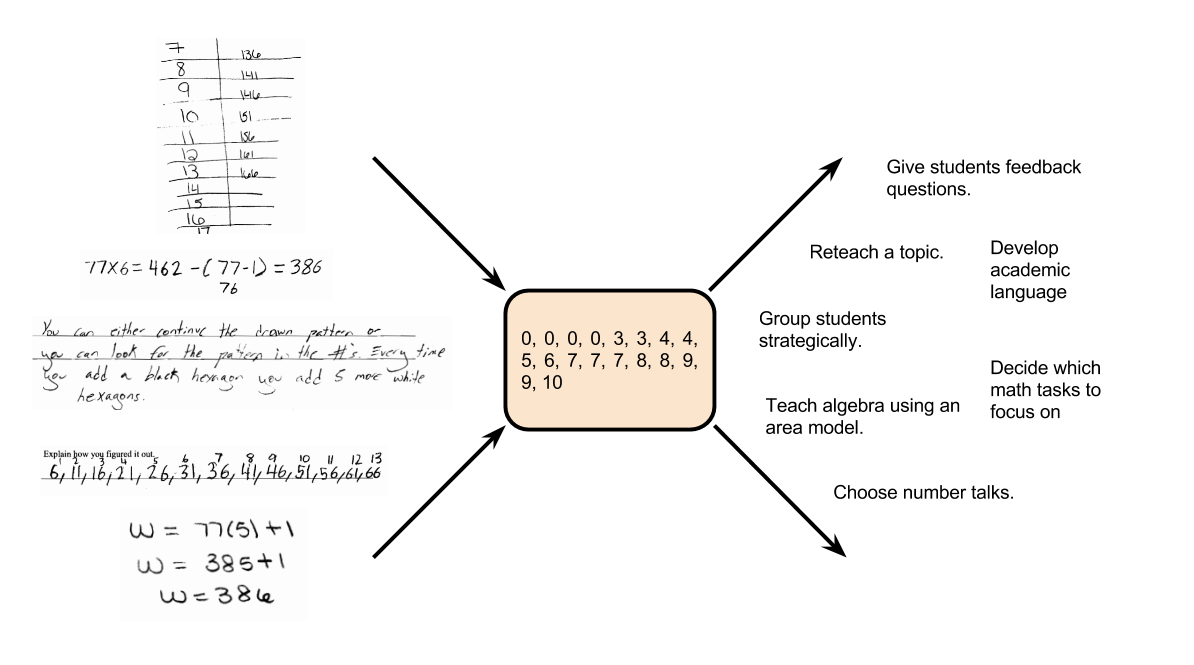
Instead, we developed a protocol and a spreadsheet tool so that teachers could look at the student work and systematically record the strategies the students were using as well as how successfully students used these strategies.
In order to develop the protocol and the spreadsheet tool, I took a sample of student work on the task and grouped it according to different types of mathematical strategies students used for each question on the task. I then decided on language that would communicate those strategies to teachers and created a set of instructions on how to go through the student work and record the strategies systematically.
Given the amount of time this takes, we decided to restrict this to just the beginning of unit assessments and suggested to teachers that instead of looking at every single student’s work, they could select a random sample of 20 to 30 students to look at in depth. We also attempted to make it clear, that while we strongly suggested that teachers try using this tool, this was not a mandated part of our project; instead the mandate is for teachers to give an initial assessment to their students and then systematically make sense of the information provided by the task.
Once we have the spreadsheet tool ready for any given unit, our data researcher uses Autocrat and a custom script a member of the New Vision Cloudlab team wrote to distribute the spreadsheets to teachers and then pre-populate the spreadsheets with their student names.
One theory I have with this work is that an excellent way for teachers to develop their knowledge of how students approach mathematical tasks and consequently understand mathematical ideas, is to systematically look at student work and record and analyze the actual strategies students have used, as represented by their written work.
An interesting finding we have so far is that although not all of our teachers are using the spreadsheet tool, many of them are systematically sorting their student work by different strategies used and making sense of the student work and then deciding on instructional next steps, based directly on the student work itself. This is very likely an idea generated by the use of the tool as we had not witnessed large number of teachers in our project using this protocol until this year.
Our hope is that by the end of this year, we will have tasks and tools available for each of the twenty units we are developing as part of our resource support for teachers.
Peter Smyth says:
Tracking how students approach tasks in one way or another is basically Montessori. Have you observed any true Montessori classes?
February 25, 2015 — 12:14 pm
davidwees says:
My son was in a Montessori class for a year, but I do not know how his teacher kept track of his work. My colleague Russell West pointed out recently that in a meeting we had about a year ago with Diane Briars, she mentioned that in her project in Pittsburgh, teachers were being asked to track strategies instead of just scores, and so although I do not explicitly remember that moment, it may be that the design of this tool is based on her sharing of her work.
February 25, 2015 — 12:22 pm
Henry Sun says:
Is there a mailing list or emailing list that I could be added to? My school district is beginning to use MARS tasks in an intentional and systematic way, and a tool like this would be awesome to have.
Thank you for all your effort on this project!
March 1, 2015 — 2:29 pm