The Reflective Educator

Education ∪ Math ∪ Technology

Archives (page 83 of 97)

Introducing Probability Using Settlers

This past week I was looking for a way to introduce probability to my 9th grade students.  One of the problems students have when they are first learning probability is developing some intuition about what to expect.

I decided that one of the best ways to develop intuition about probability is to have some strong emotions associated with the results of their initial probability experiments, so I decided to teach my 9th grade students how to play Settlers of Catan.  I didn’t give them any information about best strategies to play the game, I just taught them the basic rules and set them loose.  Here are some rules for your reference.

Settlers Map

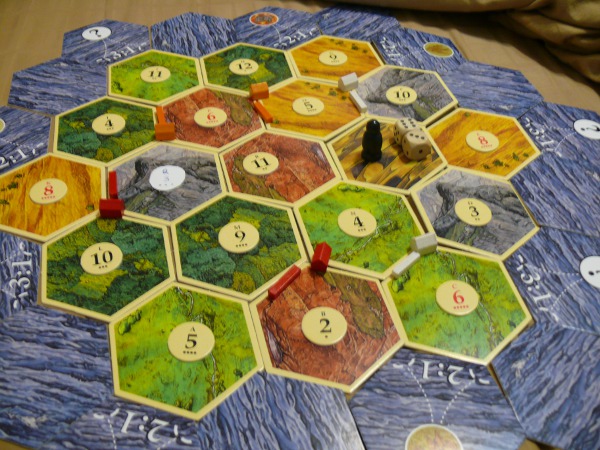
The basic idea is, each hexagon produces resources, but only when the number shown on the hexagon is rolled as the total of 2 six-sided dice.  If you have a settlement located at one of the vertexes of a hexagon which has just produced resources, you gain 1 of those resources.  You can then save up these resources, trade them with other players, or then use them to buy more settlements, cities, etc… Essentially if you gain enough resources of the right type before your opponent, and you win.

The actual system we used to play is called JSettlers, and it is an open source Settlers of Catan server.  I hosted it on my laptop with no difficulty and shared the link to my students to play it.  This way I didn’t have to pay for a class set of expensive Settlers of Catan games.

It only took about 10 or 15 minutes of playing for the kids to realize when they had made poor choices, or when someone had an obvious advantage.  The question I had once we had played for enough time that they had gathered some data (I required them to keep track of what was rolled as they played), which starting settlements were poorly placed, and which were in the best locations.  Students looked at the following situation and decided that this intersection of hexagons was a good place to put a settlement.

Good choice of settlement

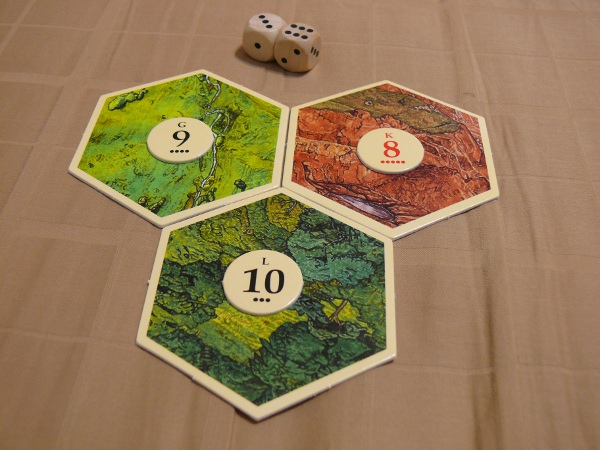
They looked at an intersection like the following and decided that this was a poor place to put a settlement.

Poor settlement location

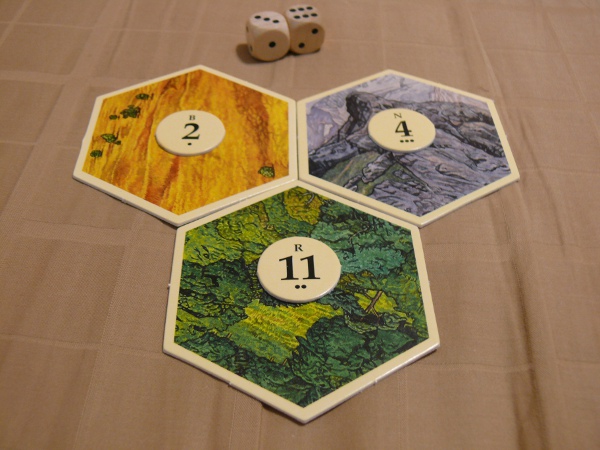
I asked them why they liked the first spot and didn’t like the second?  One of them said it perfectly, "well, the numbers 8,9, and 10 are WAY more likely to come up than 2, 4, and 11."

We followed with a discussion of why each number was not equally likely to come up using a typically sample space table, and then we kept playing, having both put some context on the probability we were learning, and developing some intuition about which numbers were more likely to come up.  I was able to extend their thinking quite a bit, as there were several different games being played, none of which had exactly the same set of numbers rolled.  It really worked well, and I’ll continue to use an example like this in my practice.

Teaching Chi squared test

I tried something new this when I taught the Chi squared test.  Instead of focusing on the formal procedure that one must follow in order to use the test correctly, I focused on what we were actually DOING when we were doing the test.  As a result my students understood the test much more easily, and I had far fewer questions about how to actually use the test.

First, we talked about the expected values, starting with the sums of the expected values.  See the following table.  Here the "Yes" and "No" refer to whether or the particular person being surveyed watches the TV show Glee.

  Yes, I watch Glee No, I do not watch Glee
Male      100
Female      100
   120  80  200

Essentially this backwards from where I started normally, with the observed values table, because I wanted students to understand how we construct this table, rather than relying on rote memorization of the formulas for the expected values.  I started with this fact, that we have 50%  males and females in our data.  Hence, I said, if gender is independent of our question about Glee, how many males should we expect to answer Yes to the question about Glee?  Students pretty easily came up with 60 males, reasoning that 50% of 120 is 60.  I focused their attention on how what they did to get this answer, and then we filled in the rest of the table.

  Yes, I watch Glee No, I do not watch Glee
Male  60  40  100
Female  60  40  100
   120  80  200

I then set up an observed values table, and filled in the table used way different numbers. I made sure students understand that the previous table represented the expected survey results if Gender wasn’t a factor in people choosing to watch Glee, but that the following table represented our actual survey results.

  Yes, I watch Glee No, I do not watch Glee
Male  25  75  100
Female  95  5  100
   120  80  200

Right away, one of the students said that this second table obviously meant that there was a relationship between Gender and choosing to watch Glee?  The reason he gave, "Well those numbers are way off the expected values."  

I then asked a really important question.  "How much different do they have to be before the results are significantly different than our expected results?"

Students realized that we’d probably want to start by subtracting our two sets of information like so.

O E O – E
25 60 -35
75 40 35
95 60 35
5 40 -35

I pointed out that we don’t really care if the difference is positive or negative, since either way the results are "way off" if the difference is big.  So we squared the observed minus the expected values to make the answer positive. Note that we haven’t really done much work with absolute value, so I chose to ignore it for this example, which helped make my case for the calculation, but probably needs some discussion.

O E O – E (O – E)2
25 60 -35 1225
75 40 35 1225
95 60 35 1225
5 40 -35 1225

Next I pointed out that the numbers were too big, and that I wanted to be able to make a comparison between the size of the difference between observed and expected values in one chart with the size of the same type of difference in another chart.  Normalization (which is not a word I used with the students) is a useful way to do this, and hence we want to divide by the expected values.

O E O – E (O – E)2 (O – E)2/E
25 60 -35 1225 20.42
75 40 35 1225 30.63
95 60 35 1225 20.42
5 40 -35 1225 30.63

Someone noticed that this was a bunch of different numbers and that it would be more useful if we had a single number, so I suggested adding up all of these normalized differences.  This number, I labelled as Χ2calculated and we had our result.  Note that my objective here was not to formalize the calculation, but more to justify the calculation informally, so that the students would feel like the understood what they were doing.

From there the rest of the lesson was relatively easy, we had a discussion about how to compare Χresults which led to the table of critical values, and with this table I introduced the notion of degrees of freedom.  I didn’t try to explain why the critical values tend to increase with the degrees of freedom or with the significance level, but the students were okay with these additional steps because the initial calculation, and reasons for the calculation made a lot more sense.  I was able to talk about the test at a deeper level than I had before, and when the students came time to actually practicing the calculation themselves, they had a lot fewer difficulties than I had anticipated.

One observation a student had was, "Using those list operations you taught us on the calculator sure would make this a lot easier," and a bunch of the students had an "Aha!" moment as they realized why I bothered to show them how to do the list operations on their calculator.

The essential difference in teaching here was using a conceptual framework versus my old method of rote memorization of the process.  I think I know which way I’ll try in the future, even with something which seems so mechanical in nature.

Museum of Math

An organization called the Museum of Math is having a contest to promote how Mathematics can be fun and exciting.  As per their website:

"Mathematics illuminates the patterns and structures all around us. Our dynamic exhibits and programs will stimulate inquiry, spark curiosity, and reveal the wonders of mathematics."

The idea of an organization which is dedicated to spreading the word about how mathematics is evident in the real world is fascinating to me, because this is a question I always have to answer.  Every single one of my classes, every year that I teach, asks me why they are learning math.  The relevance of mathematics for the typical high school student to the real world is really hard to see, especially if one is is learning the material in the more traditional way mathematics can be taught.

They are having a contest to promote both their organization and the love of mathematics.  From their website again:

Enter our Twitter contest and tell the world why you love math! The best tweet with hashtag #MathIsFun will win a free iPad. Contest ends June 1, 2010.


Some educational humor

Check out this quick comic I made using Bitstrips.com.  Maybe we can start  a whole series of comics on education, with our point of view on how education should (or should not in this case) be done using satire and humor to get our point across. (For those of you viewing this on an iPhone or iPad, check it out at Bitstrip.com as an image)

How my PLN helped me yesterday

Yesterday I posted a question on Twitter.  It was a pretty simple one, I was looking for examples of portfolios people have created because I needed to find an example to analyze as part of one of my graduate courses.

Within 10 minutes, I had a bunch of different examples from different people in my Professional Learning Network (PLN).  Here are their tweets (these images link to their examples).

All of these portfolios would have worked for my purpose, but it was great to ask a question of my PLN that I could never answer easily with a regular search engine.  I also know that these are examples that people wanted to share, which suggests that they are exemplars which makes it even more useful to me, since I want to eventually produce an exemplar of a portfolio for myself (although I suspect that may end up just being a subset of what I have posted on this blog).


Midway reflection on Apple Digital learning program

We are currently in the middle of what is known as the Apple Digital Learning Program.  I first learned about this program at a technology workshop sponsored by Apple way back in December, and through communication with my local sales representative, we submitted an application to host the DLP at my school.

How the program actually works is that you submit applications, or a set of joint applications from your school.  If Apple approves your application, and they have the hardware available, they will send you a set of very new Apple Macbooks, 10 iPod Touches, 1 digital camera, 1 digital camcorder, and 1 airport extreme base station.  You can use these devices free for a month, and then ship them back to Apple, of course if there are any problems during the month, your school is liable for any damages.

The process of getting applications back from my staff wasn’t too difficult, although it took a couple of times of putting out the word to the teachers to get some applications in.  We ended up submitting a set of 6 applications from our school, one from each of an outdoor ed teacher, a humanities teacher, a music teacher, a science teacher, and two math teachers with myself included.  

The box that arrived a couple of weeks ago looks like the picture on the left when you first open it.  The objective is to get it to look exactly like this as possible when you return the box.  There’s a decent lock on the outside and wheels on the bottom of the box.  We’ve discovered that moving the box around a lot is a pain, so we’ve moved classes of kids instead.

We had a workshop that where we worked with a wonderful instructor from Apple, her name was Julia Leong.  She was brilliant, I highly recommend having her attend your school for technology PD, even if you aren’t able to participate in the DLP.  The feedback from the teachers after the workshop was very positive, although most of the teachers are fairly technologically minded people so they didn’t have too much trouble picking up the skills and ideas Julia shared.

During that workshop, I even made a movie which was loads of fun!

The feedback from the students has been tremendous!  They have LOVED being able to use the Mac computers and have definitely appreciated that the teachers are learning with them.  The projects the teachers have been working on with the students have almost all been about creating and sharing ideas.  One of the nice things about having all of the teachers we do involved in this program is that it actually means that every student in the school, with the exception of our 12th grade students who are currently engaged with their IB exams, will get a chance to work with the laptops at some point.

We are only a couple of weeks into the program, but already I can see some possibilities that these computers offer for technology.  The first is that iMovie is extremely powerful software and makes editing movies a breeze, including some pretty advanced techniques.  My favourite part of the Mac iLife suite is how each program on the computer seems to communicate so easily with each other.  The integration between the programs is nearly seamless.

For example, I had students film themselves throwing a ball to a partner using the built in webcam on the laptops, they then learned how to crop the movie and overlay a transparent image of graph paper over their movie.  From this they collected data about their graph, which we are going to use later to determine the equation of of the motion of their graph.  We did all of this in a single block, with a group of students who had mostly never used either a Mac or iMovie before.

I recommend trying out this program at your school, it can be a way to really show your staff that educational technology is a really valuable way through which students can learn advanced ideas and skills.

Keeping in touch with my dad

My father passed away a little more than a year ago, but through the internet he still lives on.  I missed him this morning, probably because of some of the environmental stories I was reading (he was a huge environmental and rights activist) and decided to look him up.  

The first page I found when I Googled his name was his obituary which was, as it always is, a tough read. "Tim Wees packed much into his 64 years of life", it starts and the tears start to flow.  It is a bit morbid to read an obituary, but I don’t read it because it reminds me of his death, but more because it reminds me of all he accomplished in life.  I tried and imagine what it would be like before the internet, when I would have had to keep an album of newspaper clippings and photos, and one of these pages might have been his obituary if I was lucky.  Today, I can look it up online whenever I want a reminder.

Next stop is his website, timwees.com, which I am paying to keep up.  No changes happening here, but anytime I want to read something my father wrote, or listen to the sound of his voice, I can.  One of my favourite pieces of his is about Canada, a kind of montage of interesting things to see and remember about our country.  He had put up all of his writing online mostly because he really wanted to share his work.  Contradicting his desire to share his work, he carefully wrapped all of his text up in the proprietary PDF format, locking up his work from being changed ever.

One of his pieces of work is still being discussed on the internet. In the early 90s, my dad lived on the street, and collected some stories of street children.  His work, No Where Was Home was written from the heart.  I wonder now what has happened to those children, but from a discussion I found on Facebook, it looks like they are still connected to each other and discussing his work.  Pieces like his are a record of the parts of our country which are rarely discussed in as much detail on the nightly news.  They are important, and I’m proud of him for having written it.

I can find comments my dad wrote on other people’s stories, and find stories which quote him.  There are hundreds of pages on dozens of websites that my dad contributed to, and I haven’t read all of them.  Still it is an interesting archive of his thoughts and opinions.

One thing I cannot find of my dad is many pictures of him.  I have a few that I’ve found, but my father was behind the lens of the camera too often for me to find photos of him.  Here’s one that I like, which I found after much digging through his website.  Once this particular post I’ve written is indexed by Google, this photo below will show up when I search for my dad.  

Tim Wees
Tim Wees and my son Athanasios (April 2007)

The digital record we leave behind on the internet keeps us alive in a way not possible in previous generations.  It is not hard to take an ordinary person’s life, and if they had any presence on the internet in life, find them "present" virtually on the internet.  The current generation of children will grow up in a world where finding a Youtube video of their parents online is straight forward.  They will be able to interact with their parents after they die in ways which are profoundly different than any other previous generation.  Instead of having to rely on carefully guarded (and easily lost) family archives of old family photos and movies, they will be able to Google their parents anytime they like, even after their parents’ deaths.


How is Twitter better at search than Google?

Wordle - Twitter as Search

When you type in a search phrase in Google, you are relying on the search algorithm Google provides to give you the most relevant search results for your query.  The problem is, people have learned how to game those search results, and quite often the best and most appropriate information isn’t going to  show up in the top search results for your query.

You want proof of this? Do a search for "pills" on Google.  I find it very unlikely that a website which exclusively sells male "enhancement" drugs should be so near the top of the list for Google results for this particular search.  Obviously someone has done some trickiery to get their site to be ranked high.  One of the most obvious tricks that is used to game Google is to add links to other people’s blogs, generally through spam comments.  Another trick is to add referral links to other people’s legitimate sites, hoping these will be picked up by Google Adsense. Update: Apparently Google has found a way to suppress all of the "male enhancement" websites that used to show up for this particular search term. I’m looking for a replacement example.

However in Twitter, you can choose exactly which sources of information you want to include in your stream.  You can even say hello to your sources of information and meet them in person at events called Tweet-ups!  Instead of relying on a machine algorithm which can be manipulated by unscrupulous 3rd parties, you can have extremely recent and accurate information about the world delivered to you.

If you want evidence that Google is worried about this phenomena, check out their recent moves in terms of joining the "status update" wars.  They have developed a new product called Google Buzz to try and draw people into their platform for delivering search, as well as adding recent upgrades to their established Google Reader product to perform the same functionality.  They have even added "live search results" to their archived search results in their main ad engine.

Even Google has realized that data which is ranked by live human beings is much more valuable than machine sorted data.  Until a machine can analyze two new math websites with no external links to either and tell me which is the best one for my 8th grade class, they aren’t going to be able to compete with a human being in terms of digesting and analyzing information.

You can even send out a question on Twitter and assuming you have enough people following you, you can get a response back.  You may get multiple responses back, and get different perspectives on how your particular problem should be approached.  One person I met described posting questions to Twitter as, "hundreds of grad students working on your individual problem."  If no one knows the answer, or if your question is not interesting enough, you may even not get a response!

A further example of the power of Twitter is the ability of the people who form the Twitter network to self-organize. They can hold chats about specific topics (as is evidenced in the teacher #edchat on Tuesdays) or use Twitter to organize conferences (like the ISTE 2010 conference being organized on the #ISTE10 channel of Twitter).

Twitter is currently much more democratic than Google. You decide on who you follow, you decide on which filters you want to apply to their data, and you decide what information you share.  I think that the internet needs to be fundamentally a democratic place in order to be successful as a source of reliable and accurate information.

As a search engine, Twitter is closer to the future and is an excellent way of learning about the world around you.  I think that the number of Google searches I do each day has greatly decreased, largely because of this new way I have to collect information.  Each person in my follower network does part of the job of checking if the information I would have found in a Google search is worth looking at, decreasing the amount of work I have to do to sift through Google’s endless pages of search results.