One of the most challenging topics to teach in high school mathematics is “Completing the Square.” This is because educators do not always fully understand the topic and because it includes several algebraic steps that are incredibly challenging for students.
An eye-opening experience was when I first generated visuals for each step in completing the square using an area model.
Algebraic Step
Visual Model
x² + 6x + 8
x² + 6x + 8 + 1 – 1
x² + 6x + 9 – 1
(x + 3)² – 1
The name “Completing the Square” is not arbitrary! Visually, one can see that we are literally taking an incomplete square (at least in cases like the one above) and making it complete. This visualization makes the algorithm’s goal obvious and helps students see what they are trying to accomplish.
However, the steps above are not sufficient for students. The area model above is much easier to understand if you already know the mathematics it represents. Since children don’t, we need to introduce the area model with more straightforward examples before using it for more complex ones. Here’s a worksheet that aims to do this.
Once we have used the area model to establish the purpose of the steps when completing the square, we gradually remove the visuals. This is because we don’t want students to need to draw out the visuals each time to help them solve the equation. The goal is for students to understand conceptually what completing the square is and what steps are needed to complete it. The visuals are an aid for this goal.
There are other cases to consider (for example, expressions like x² + 6x + 10 and 2x² + 6x + 10). Once students have a handle on the simpler cases, these examples will be easier for them to manipulate algebraically.
The key idea here is that some ideas are much more obvious when represented visually than when we focus purely on a symbolic approach.
I did not understand what it would feel like to be isolated from the math education community when I wrote this.
After more than five years away from NCTM conferences and with the demise of Twitter as a valuable space to chat with other educators, I feel more alone, professionally, than I have at any other point in my career. I bought some carbon offsets to mitigate, as much as possible, the environmental cost of my participation. I decided to rejoin the community by coming to Washington, D.C., to present at the upcoming NCTM conference.
I’m presenting an instructional routine educators can use to teach their students how to argue constructively in math class. It will be similar to this online workshop I facilitated three years ago.
It would be great to connect with others going to the conference! Karaoke, anyone?
I’ve used three different inquiry-based teaching and learning models at various times in my career. These models have in common a desire for students to construct their own understanding and recognize that students are capable sense-makers.
Driven by student questions: In this model, students are given a topic and asked to generate questions they have about it, and answering these questions drives the instruction for the unit. Individual concepts might be taught directly to students or introduced using project-based or problem-based inquiry. The critical aspect that makes this kind of unit inquiry-based is that students have ownership over the direction of what they are learning.
Project-based learning: In this model, students are given a project to work on or select for themselves. While working on the project, students or their teacher identify the skills or knowledge they need to complete the project. These might be taught directly to the student, learned through reading and research, or developed using problem-based inquiry. The critical aspect that makes this inquiry-based is that the project drives the knowledge needed.
Problem-based learning: In this model (which typically focuses on individual lessons), students are presented with a problem or question to solve, they work independently from the teacher but usually with a partner or small group in solving the problem, and then the teacher selects a small number of students or groups to present their various results. An example of a suitable problem might be a lab in science, an analysis of a poem, or a mathematical puzzle. The critical aspect that makes this inquiry-based is that students’ ideas drive the instruction rather than the teacher’s.
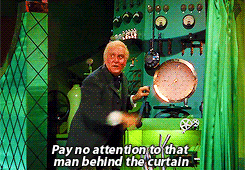
Unless you have been living under a rock, you have heard about a surge of people using artificial intelligence in art and writing to algorithmically produce original art work and original writing. Basically, people open up one of these services, enter in a prompt and set some inputs for the art work or the writing, and the system “magically” behind the scenes delivers the new art work or the new writing sample.
AI is like the Wizard of Oz
There are lots of moral questions that these services surface (E.g. Who owns the intellectual property that results from art work derived from analyzing an artist’s work?) but I’m currently concerned about the information is provided by these services. To understand my concern, one must first understand how these services work.
There’s a lot happening behind the scenes here that is worth knowing about in order to understand how these services work. Essentially, a set of training data is fed into an algorithm, which uses statistics to analyze the training data and determine the most important features of the training data set. The actual process is more complicated but, crucially, relies on an external source of information from which the algorithms derive insight.
I used ChatGPT to generate answers to some common questions in education that a student-teacher might have. The results were both impressive and worrying.
The results were impressive because this algorithm took relatively complex questions and generated realistic answers to these questions. The results are worrying because each of these answers is woefully incomplete in some critical way. Someone using this system as their sole mechanism to understand education will be left with a limited understanding of how education works.
Here are some responses to some questions about teaching. Let’s look at a couple of responses regarding learning styles.
What are learning styles?
Learning styles are different approaches or ways in which individuals understand and retain new information. Commonly recognized learning styles include:
Visual: learning through seeing, e.g. diagrams, videos, and graphs.
Auditory: learning through hearing, e.g. lectures and discussions.
Kinesthetic: learning through physical experience and movement, e.g. hands-on activities and experiments.
Reading/Writing: learning through reading and writing, e.g. texts and notes.
It’s important to note that individuals may have a dominant learning style, but often use a combination of styles in their learning process.
Are learning styles useful in teaching?
Yes, learning styles can be useful in teaching as they provide a framework for understanding individual differences in the way students process and retain information. By taking into account the learning styles of their students, teachers can tailor their instruction and presentation of material to reach a wider range of learners.
However, it’s important to note that the concept of learning styles is not universally accepted in the educational community, and some researchers argue that it’s not a useful or accurate way to categorize learners. Thus, it should not be used as the sole basis for instructional decisions, but rather as one of many factors to consider when designing lessons and assessments.
If this idea of learning styles is false, why does ChatGPT present it as true? The answer comes from how ChatGPT generates its responses. Recall that these systems rely on external data sources to create their generated responses. If these external sources of data contain bias or have a commonly accepted truth that is actually false, the output will contain these bias and falsehoods.
Garbage in, garbage out
I’m not yet concerned that these artificial systems are ready to take over the jobs of teachers. I’m worried that policy makers will think that artificial intelligence is ready for education. I’m worried that students will use these systems to do their writing for them and fail to be exposed to more nuanced perspectives. As Henri Picciotto so eloquently says, “There is no one way” but ChatGPT currently produces a single not-quite-right answer.
While many people think of 2020 as “that year from hell that just kept on going”, I also think of it as the year that mathematical literacy became an obvious necessity. In many different stories this year, mathematics featured prominently as a way to understand the world.
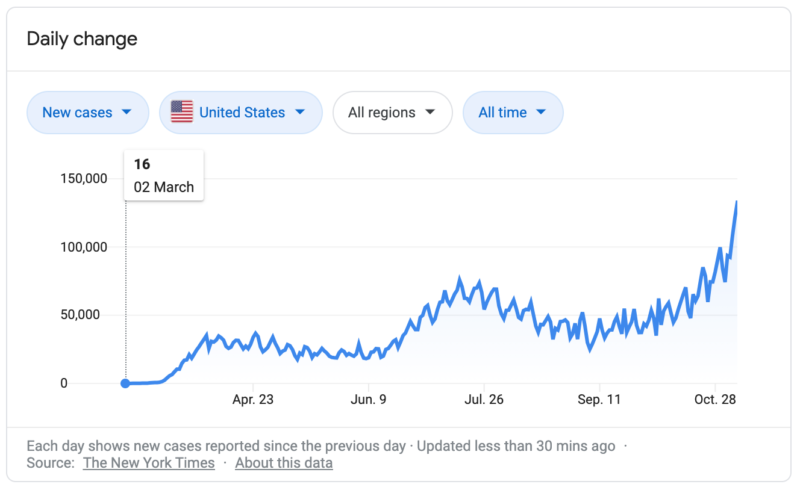
As everyone knows, in the first months of this year, the pandemic started. Not surprisingly, a lot of coverage in 2020 focused on the number of cases, the spread of the Coronavirus. What might be missing for that coverage is the mathematical literacy required by the people consuming it.
Here are a few areas where mathematical literacy is needed in order to deeply understand the arguments being made by epidemiologists and policy makers in relation to the pandemic.
Exponential Growth
Number of new cases over time
Understanding these graphs requires mathematical sophistication. For example, the graph above shows the number of new cases over time. From my experience working with kids, I know that many of them perceive flat areas on graphs as areas where no change is occurring. However, this graph is showing new cases, which is related to the rate of change of the number of people infected, not the total number of cases. Many people interpret this graph as meaning that the spread of the virus was levelling off in April, but that part of this graph is still showing roughly 30,000 new cases a day!
The general public was also introduced to a new term for them, R0, also called the basic reproduction rate. R0 = 1 means that each person who gets ill, on average, infects one other person while they are able to infect others. R0 = 2 means that each person infects 2 other people on average. Any R0 > 1 corresponds to exponential growth of the infections. Communicating to people that R0 = 1.1 is much, much better than R0 = 1.5 has been challenging. The table shows the relationship between each generation of infection and various R0 values. Notice how much of a difference a small change in the R0 values makes.
R0 = 1.1
R0 = 1.5
R0 = 2
1000 infections
1000 infections
1000 infections
1100 infections
1500 infections
2000 infections
1210 infections
2250 infections
4000 infections
1331 infections
3375 infections
8000 infections
A table showing how R0 impacts total infections
Ratios and Proportions
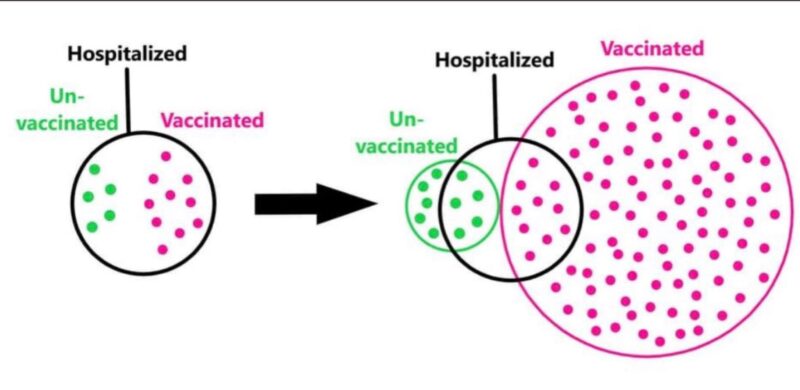
A Facebook friend recently argued that the Coronavirus vaccination must not be working because more vaccinated people had died in the past month than unvaccinated people, 52 to 48. First, let me just say that any people dying from this disease is heartbreaking. That being said, this argument fails to apply some basics of ratios and proportions.
In the area of the world my friend lives, roughly 90% of people eligible for vaccination are vaccinated. Suppose this corresponds to 80% of the people who can potentially contract the disease and that my friend lives in a town with 100,000 people. 52 of 90,000 people is a much smaller percentage (≈ 0.06%) than 48 of 10,000 (≈0.5%). In fact, if one considers the relative rates of death, being vaccinates increases one’s odds of survival by almost ten times, relative to being unvaccinated.
Probability
In a brilliant and interactive essay meant to argue for the power of wearing masks, Aatish Bhatia uses probabilistic arguments to show that one mask is better than no masks, and that each person wearing a mask is much better than one person wearing a mask. This argument unfortunately relies on people understanding probabilistic reasoning.
Two commonly fallacious arguments rooted in misunderstandings of probability are the use of anecdotal evidence to argue against probabilities (“My friend was wearing a mask, and they still got Coronavirus”) and assuming that low probability means zero probability (“Those scientists said that the vaccinations would protect us from the Coronavirus”).
The first argument forgets that when one finds an example of an event occurring, there are many examples one may overlook of the event not occurring. The second argument assumes that the goal of vaccinations may be to prevent infection, serious illness, or death, when the goal may simple be to reduce the probability of these events occurring.
Statistics
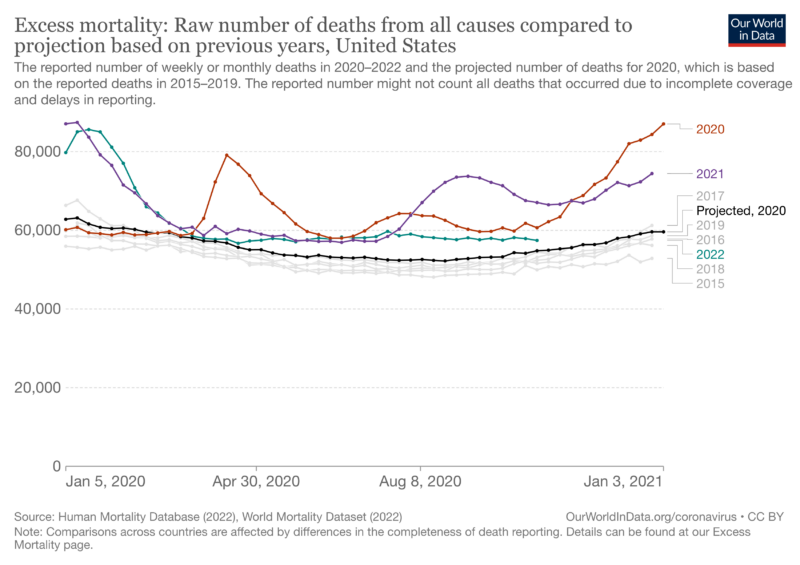
One way we know the impact of the Coronavirus in terms of mortality is indirectly through a statistic called Excess mortality. Essentially, our society and those around the world to varying degrees, keep track of the typical rates of death from various ailments. Excess mortality is the difference between the typical rates of death from all known causes and the existing rates of death during a crisis like the Coronavirus pandemic. When the reported rates of death exceed the expected rates of death by a statistically large enough margin, we can attribute the excess deaths to whatever change in environmental factors currently exists, such as the pandemic.
Understanding this argument requires one both to understand the prior year deaths are highly consistent making future years’ deaths predictable and that the deaths from the two current years completed during the pandemic differ significantly from this average. These ideas might be intuitive for some versed in reading statistical plots but are not at all obvious to someone with a poor background knowledge of statistics.
All of these areas of mathematics are already part of a typical school curriculum. People may have learned them in high school, but have subsequently forgotten them. However, it is more likely they never had an opportunity to learn them, as they are often part of the optional math courses towards the end of high school. This to me reinforces the argument that a greater level of mathematical literacy is necessary more than ever for people to be fully informed citizens.
There is a widely accepted truth that learning in math is strictly hierarchical. Before children can learn how to factor polynomials, they have to first learn how to factor whole numbers. Before they can learn how to classify polygons, they have to learn what all the different types of triangles are. But this idea is false.
It is true that one will find factoring the polynomial x2+8x + 12 easier and faster to do if one knows the factors of 12 are 1, 2, 3, 4, 6, and 12. We might be able to say that knowing how to factor 12 is a prerequisite for factoring the polynomial x2+8x + 12. This is a much narrower version of hierarchical knowledge structure where with careful curriculum design one can deliberately select numbers for factoring polynomials that are known (or at least likely to be known) to students. It is well established that there are some multiplication facts that students find easier than others; if we restrict ourselves to only using the factorizations that children are more likely to be familiar with, then at least when introducing the idea of factoring polynomials, we offer a greater variety of children access to the ideas.
But it is also possible to continue to teach students how factor numbers while teaching them how to factor polynomials. First, we remember that it is likely that if a child reaches our classroom and does not know some idea from a previous year, they have unfinished or incomplete learning, not unstarted learning. We don’t need to introduce the idea from scratch; we can probably rely on relearning opportunities instead. Next, we can and should always embed opportunities for learning prior ideas in our teaching since students always come to us with varied understanding. This does not mean having the different goals for different students, rather that we know our aim is to reduce variance in student understanding and build a community of learners in doing so. (Aside: An excellent tool for supporting incomplete learning are the instructional routines described by Routines for Reasoning and the fine folks at the Teacher Education by Design project.)
Formative assessments are tasks selected by educators intended to help them gain insight into what children can do, know, or believe. Formative assessment is “the process used by teachers and students to recognise and respond to student learning in order to enhance that learning, during the learning” (Cowie & Bell, 1999 p. 32).
Formative assessments are tasks done by students. Formative assessment, the process, has educators clarify the learning intentions with students, activate students as owners of their own learning, activate students as resources for each other, elicit evidence of student learning, and provide opportunities for feedback that move the learning forward (aka. The five formative assessment strategies from Wiliam, D., 2011, Embedded Formative Assessment).
Formative assessments require a careful distinction to be made between the purpose of the assessment; if an educator uses the assessment to evaluate the student and creates grades from the assessment it’s actually summative. If they use the information to modify their instruction, the assessments are formative. Formative assessment, the process, requires no such distinction.
Formative assessment, the process, has a rich set of research that supports how it improves the learning conditions for students. Formative assessments, by contrast, sometimes end up with teachers having their vitality sucked from them as they pour over spreadsheets full of numbers but no insights trying to figure out how to improve student learning.
Formative assessment can be embedded in everyday instruction so that action can be taken immediately whereas formative assessments nearly always require educators to set aside time to give the assessments and time later to look at the results.
Formative assessments are an important dimension of formative assessment (since they do provide an opportunity to elicit evidence of student learning), but the full set of formative assessment practices have a far richer impact on student learning.
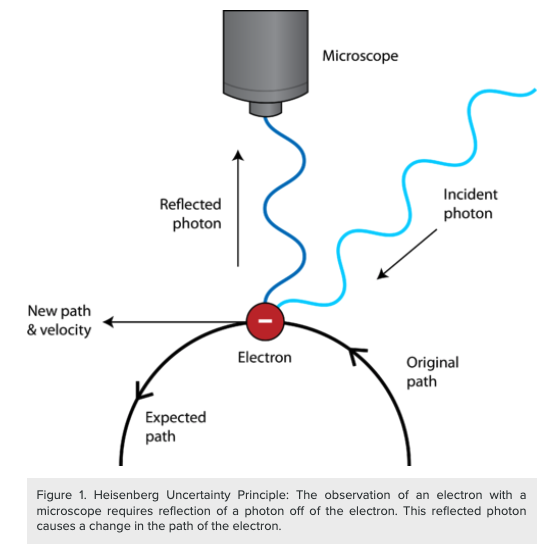
In physics, there is a limitation on the measurement of particles called the Heisenberg Uncertainty principle. The principle says, “the position and the velocity of an object cannot both be measured exactly, at the same time” (source). The reason why is that the act of measuring the position of a particle changes the uncertainty in its velocity and the act of measuring the velocity of a particle changes the uncertainty in its position. The more precisely we measure either quantity, the greater the uncertainty in the other. The critical idea is that by observing a particle, we introduce uncertainty in what we can know about the particle because the act of measurement changes the particle.
In a similar way, assessing a learner changes that learner. There are three ways learners can change during the process of assessment.
Every time we retrieve ideas from our memory, our ability to retrieve those ideas again is strengthened, even if we are unsuccessful in remembering the idea. Our memories are not like computers, they tend to strengthen as we revisit ideas and diminish otherwise.
As we attempt tasks and are successful or not successful on a task within a particular domain, we adjust our self-image within that domain. When we repeatedly fail to accomplish a task, we tend to think of ourselves as unable to be successful. When we accomplish tasks too easily, we tend to put less effort into more challenging tasks.
Some tasks and supports for accomplishing those tasks give us the opportunity to learn new ideas. As a result, every time we solve a new problem, we are changed a little by the experience.
I’ve often heard it said that during assessment learning stops, but it’s possible that lots of learning can be taking place during these times, depending, of course, on the nature of the assessment.
There are two main ways teachers can avoid this happening in their class.
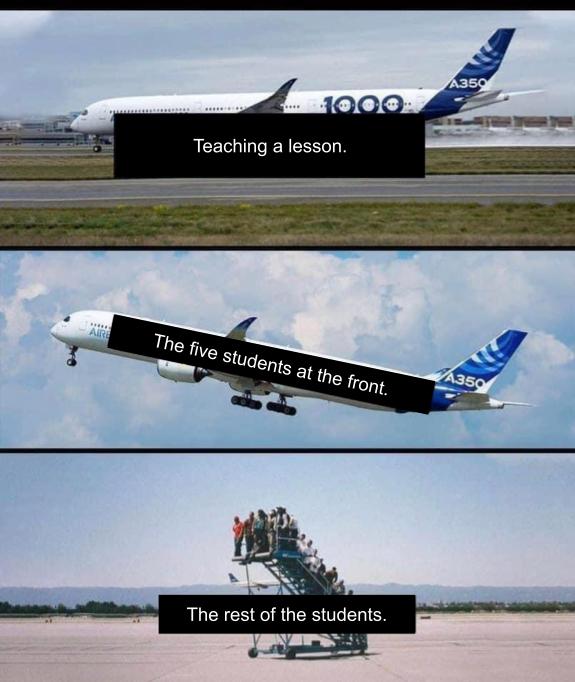
The first is through participatory engagement where activities are designed so that all students have a role in the activity. Sometimes this looks like students answering questions on individual mini-whiteboards so that for every question every student answers and at other times this looks like all students working in small groups on group-sized whiteboards (see non-permanent vertical surfaces).
In both cases, the key idea is that in order to prevent some students from not getting on the plane, the teacher needs insight into what every student is learning.
Many teachers have told me that they have difficulty feeling like their students are engaged in their remote classes. They open up their synchronous Zoom sessions and see 20 black squares with the video off. They see 30% of the students completing homework. Attendance in their classes is way down.
Here are some theories about what might be happening.
School is about compliance, when we remove the relational aspects of school, students stop complying.
Students are uncomfortable sharing themselves on camera. After all, almost none of them have experienced remote teaching via Zoom and there is strong peer pressure to conform to what the rest of the group does — would you be the only student with your camera on?
Students are unable to turn their cameras and microphone on because the conditions at their home don’t allow it. Maybe they have siblings who are also on Zoom sessions and/or they don’t have private space to attend class?
Students might not know how to turn on their cameras. In the past 8 months, I’ve helped at least a dozen people learn how to use Zoom for the first time and in almost all of these cases, I spoke with the person on the phone and coached them through doing things like starting a Zoom session and turning on their cameras. It stands to reason that at least some children don’t know how to use this technology either.
Students feel uncomfortable sharing their thinking and emotions during mathematics class because they feel anxious to perform. Math class is already challenging for many students, learning remotely is certain to be more difficult, so whatever emotions students feel about math class are likely to be heightened.
Which of these issues is the main issue? I don’t know! I suspect that a variety of different issues impact student engagement and participation in math class. Rather than offer a neat solution, I’ll suggest a process we can go through to find a solution.
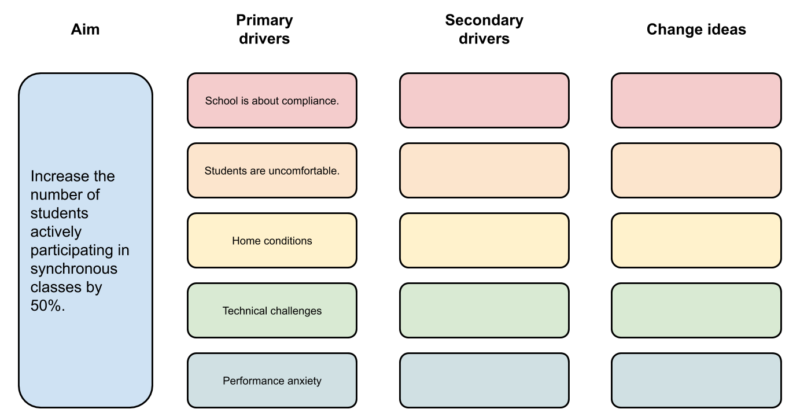
The proposed drivers of student engagement in math class.
Each of these primary drivers of student engagement/participation potentially can be broken down further into secondary drivers. For example, if our primary driver is “Home conditions” then this might be broken down into secondary drivers of “No Internet”, “No private space”, and possibly “No time”.
For each secondary driver, we propose a change. What can we do differently in order to impact this aspect of the challenge? For example, if students do not have Internet at home, then we find out if we can provide home WiFi hotspots, much like this report suggests many rural school districts have done. For some of these drivers, we may not yet have a change idea and that’s fine but as we work together to solve this problem, our collective efforts may yet yield some strategies we can try.
Ideally, instead of everyone trying to tackle this problem independently, we work together to find solutions that appear to work in our varied contexts and then report back these proposed solutions for other people to test. When faced with a common problem, we are more likely to find robust and replicable solutions if we work together on the problem.
I have some wonderings though that I think our hive mind might be able to answer?
Are these the right primary drivers? Are these reasons above realistic reasons why students might have trouble engaging in even the most basic sense in math class?
Can we break these primary drivers down into secondary drivers? Can we determine what potential issues might exist in each of these categories?
What change ideas do you have? If you have identified and solved a problem that relates to student engagement, please share it here! I know of many teachers who are desperate for ideas to make their classes feel a bit more normal.