While many people think of 2020 as “that year from hell that just kept on going”, I also think of it as the year that mathematical literacy became an obvious necessity. In many different stories this year, mathematics featured prominently as a way to understand the world.
As everyone knows, in the first months of this year, the pandemic started. Not surprisingly, a lot of coverage in 2020 focused on the number of cases, the spread of the Coronavirus. What might be missing for that coverage is the mathematical literacy required by the people consuming it.
Here are a few areas where mathematical literacy is needed in order to deeply understand the arguments being made by epidemiologists and policy makers in relation to the pandemic.
Exponential Growth
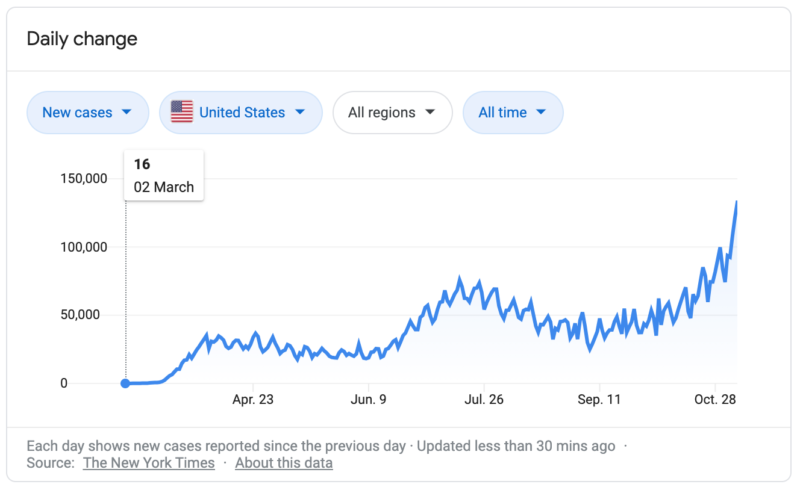
Understanding these graphs requires mathematical sophistication. For example, the graph above shows the number of new cases over time. From my experience working with kids, I know that many of them perceive flat areas on graphs as areas where no change is occurring. However, this graph is showing new cases, which is related to the rate of change of the number of people infected, not the total number of cases. Many people interpret this graph as meaning that the spread of the virus was levelling off in April, but that part of this graph is still showing roughly 30,000 new cases a day!
The general public was also introduced to a new term for them, R0, also called the basic reproduction rate. R0 = 1 means that each person who gets ill, on average, infects one other person while they are able to infect others. R0 = 2 means that each person infects 2 other people on average. Any R0 > 1 corresponds to exponential growth of the infections. Communicating to people that R0 = 1.1 is much, much better than R0 = 1.5 has been challenging. The table shows the relationship between each generation of infection and various R0 values. Notice how much of a difference a small change in the R0 values makes.
| R0 = 1.1 | R0 = 1.5 | R0 = 2 |
| 1000 infections | 1000 infections | 1000 infections |
| 1100 infections | 1500 infections | 2000 infections |
| 1210 infections | 2250 infections | 4000 infections |
| 1331 infections | 3375 infections | 8000 infections |
Ratios and Proportions
A Facebook friend recently argued that the Coronavirus vaccination must not be working because more vaccinated people had died in the past month than unvaccinated people, 52 to 48. First, let me just say that any people dying from this disease is heartbreaking. That being said, this argument fails to apply some basics of ratios and proportions.
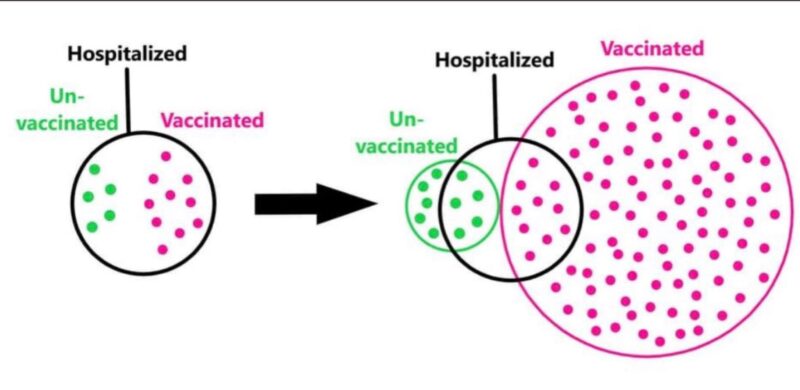
In the area of the world my friend lives, roughly 90% of people eligible for vaccination are vaccinated. Suppose this corresponds to 80% of the people who can potentially contract the disease and that my friend lives in a town with 100,000 people. 52 of 90,000 people is a much smaller percentage (≈ 0.06%) than 48 of 10,000 (≈0.5%). In fact, if one considers the relative rates of death, being vaccinates increases one’s odds of survival by almost ten times, relative to being unvaccinated.
Probability
In a brilliant and interactive essay meant to argue for the power of wearing masks, Aatish Bhatia uses probabilistic arguments to show that one mask is better than no masks, and that each person wearing a mask is much better than one person wearing a mask. This argument unfortunately relies on people understanding probabilistic reasoning.
Two commonly fallacious arguments rooted in misunderstandings of probability are the use of anecdotal evidence to argue against probabilities (“My friend was wearing a mask, and they still got Coronavirus”) and assuming that low probability means zero probability (“Those scientists said that the vaccinations would protect us from the Coronavirus”).
The first argument forgets that when one finds an example of an event occurring, there are many examples one may overlook of the event not occurring. The second argument assumes that the goal of vaccinations may be to prevent infection, serious illness, or death, when the goal may simple be to reduce the probability of these events occurring.
Statistics
One way we know the impact of the Coronavirus in terms of mortality is indirectly through a statistic called Excess mortality. Essentially, our society and those around the world to varying degrees, keep track of the typical rates of death from various ailments. Excess mortality is the difference between the typical rates of death from all known causes and the existing rates of death during a crisis like the Coronavirus pandemic. When the reported rates of death exceed the expected rates of death by a statistically large enough margin, we can attribute the excess deaths to whatever change in environmental factors currently exists, such as the pandemic.
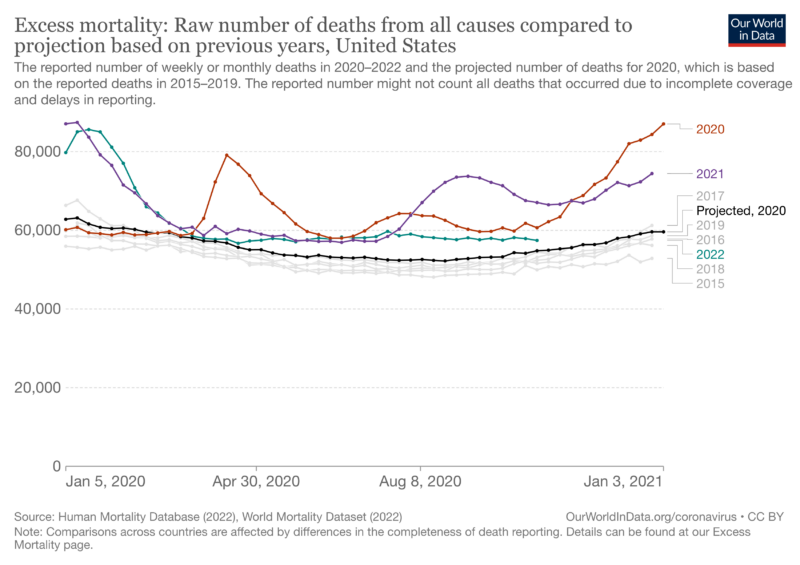
Understanding this argument requires one both to understand the prior year deaths are highly consistent making future years’ deaths predictable and that the deaths from the two current years completed during the pandemic differ significantly from this average. These ideas might be intuitive for some versed in reading statistical plots but are not at all obvious to someone with a poor background knowledge of statistics.
All of these areas of mathematics are already part of a typical school curriculum. People may have learned them in high school, but have subsequently forgotten them. However, it is more likely they never had an opportunity to learn them, as they are often part of the optional math courses towards the end of high school. This to me reinforces the argument that a greater level of mathematical literacy is necessary more than ever for people to be fully informed citizens.
1 Pingback