The Fraser Institute released their annual "report" on the Foundation Skills Assessment (FSA, a standardized exam given to 4th and 7th grade students in British Columbia) results. As usual there have been complaints about the validity of the results, and some interesting side stories. I decided to look at the Fraser institute’s results from a particular perspective. I took the FSA data and isolated the "parent income" and available FSA results (out of 10) from the Fraser Institute data. (I could have used the data from the BC government’s education site, but the Fraser Institute data was more convenient to work with.)
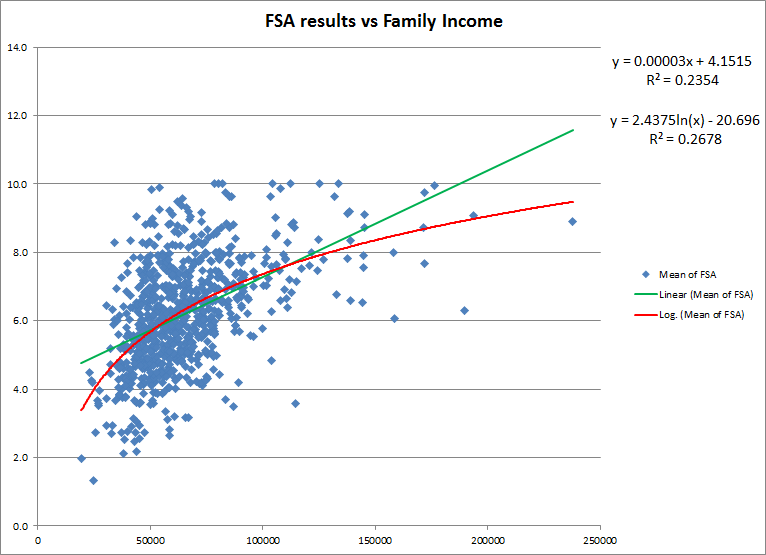
After writing a script to scrape the data (download the raw data here) from the PDF provided by the FSA, throwing away schools for which either FSA results or parental income was unknown, I graphed the data.

From the graph it seems clear that there is some sort of relationship between the two variables, but it is not clear how strong the relationship is between family income and FSA scores.
So I’ve calculated a couple of regressions for a linear fit and a logarithmic fit between the two variables. The value of the correlation coefficients are approximately 0.485 and 0.517 respectively (square roots of the r2 values given above), which given the large number of data points is statistically significance, showing that there is a moderate to strong relationship between the mean family income of a school, and the mean FSA scores for a particular school.
This type of analysis has been done before for other standardized tests, most notably the SAT exams in the United States. What this type of analysis shows is that standardized exams like the FSA are better measures of the wealth of a community than the strength of the schools in that community.
The Fraser Institute rankings are a flawed comparison of schools. It is not possible to fairly rank schools of different socio-economic status because of this strong relationship between scores and the family income. What would be more fair would be to re-rank the data and break it down into different sub-classes based on socio-economic status and not try to compare apples and oranges.
What would be even more fair would be to throw out the exams all together. What we really want to know is how effective our schools are at ensuring that our students are successful. Given the enormous complexity of this issue, and the wide variety of variables involved, finding a solution to that issue will be extremely difficult. A standardized exam is like a fast-food approach to collecting data, it is cheap and fast, but not very filling.
Peter (@polarisdotca) says:
Interesting graph, David. I’m no statistician but I have read my fair share of graphs and there are a couple of things that jump out at me. Full disclosure: my kids go to a school rated only 3.8 by the Fraser Institute and I’m trying very hard to be objective!
What I do see from the lower-income families on the left side of the data-blob, ANY school rating is possible. This is what we hope for, of course: kids at any school can succeed.
The most obvious characteristic of the plot, though, is the lack of data in the lower right, corresponding to lower ratings for schools where parents have higher income. Could it be these data were missed – are these the parents who opt out? I don’t think so, given the low participation rates at many schools included in the report (only about half the students wrote the FSAs at my kids’ school.) So why the void? Here’s how I interpret the graph: to achieve a high rating, you do not have to go to a “rich” school. However, the higher the socio-economic status of the family, the higher the kids score on the FSA. What happens at home for the other 18 hours of the day matters. Er, I think we knew that already.
February 9, 2011 — 12:19 pm
David Wees says:
Yeah, I interpret the blob the same way, but wasn’t sure how to characterize it. Certainly the presence of the blog is reassuring and means that the efforts of the public schools are not in vain, provided you believe that a better FSA ranking corresponds to a better school. I’m not sure that this is always true. If you really want to know if the school your daughter goes to is good, spend a day there listening to the students and watching the interactions between the teachers and the students, and between the students. You can’t measure everything which is important about a school with an assessment like the FSA.
February 9, 2011 — 12:26 pm