One of the teachers I work with used Angry Birds as a context for learning about quadratic functions. Whenever they wanted to introduce a new topic, they referred back to the context of Angry Birds so as to give students a representation of quadratics with which the students may be familiar.
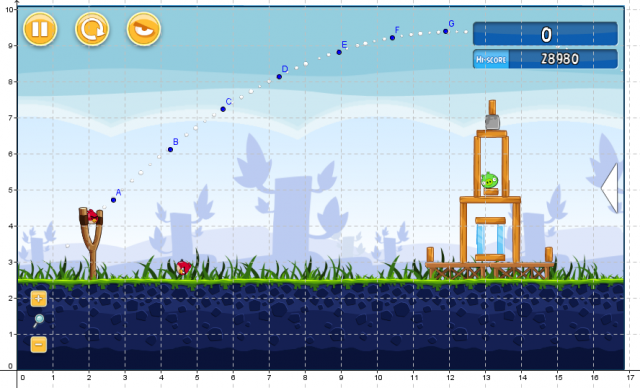
Let’s see what that could look like. Here’s one angry bird shot.
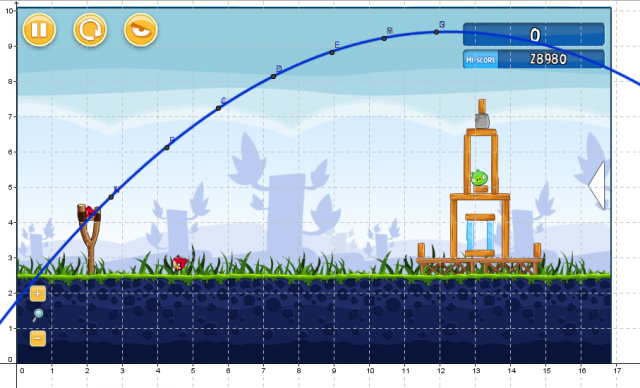
Here’s the data from the shot above inputted into Geogebra.

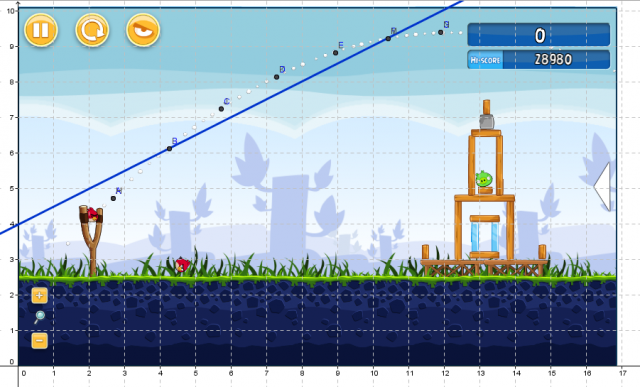
You could then use this graph to ask a lot of questions, particularly about the shape of the flight path of the bird. Does this shape look like a line? Why or why not? Have you seen this shape before? What is important about this shape? What do you notice about this shape? Many of these questions would naturally lead into the types of things that might be addressed in a unit on quadratic functions.
You could use the Three Acts format Dan Meyer has produced and use the medium of Angry Birds to ask questions. What questions do you have after watching this video? Which of those questions are mathematical? What information do you need to answer those questions?
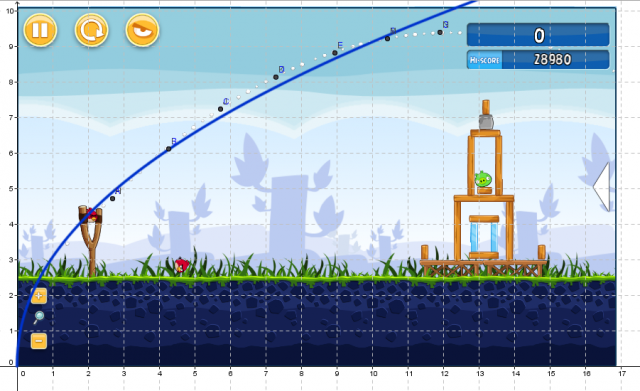
Which of the following graphs best fits the data given? Why? What are some problems with this fit to the data?


What questions do you have after watching this video?
This last video presents some challenges for the students. The video zooms in and out, which means that when students are collecting data, they will need to find a way to account fo the scale differences between the different shots. This requires them to use skills that they probably haven’t used in this context, and for algebra students, they may not have used proportional reasoning in a while.
If I were using this in a class, I might try and reframe the problem in terms of a real life catapult, and see if students can transfer what they have learned from studying quadratic functions in the context of Angry Birds to the motion of their catapults, perhaps with some sort of challenge to knock over a popsicle stick tower.