Almost every school district across the United States is thinking about how they use data to inform instruction. Not all of them are doing so in ways that I think are likely to lead to useful change.
Below is an example of the kind of data that has no useful impact on instruction ever. The data content in the picture below is high but the information content is low. How exactly is this information supposed to help a teacher make sense of what she should do with her students?

Here’s a slightly more useful variation on the same data where it has been organized to potentially be suggest some next steps. However, there’s a critical piece missing in this data – the actual task students did! Without knowing what the questions were that were asked and without knowing what the responses below refer to, this is meaningless information. The only take-away that I have from the information below is that it is unlikely for these multiple-choice questions that students were guessing.
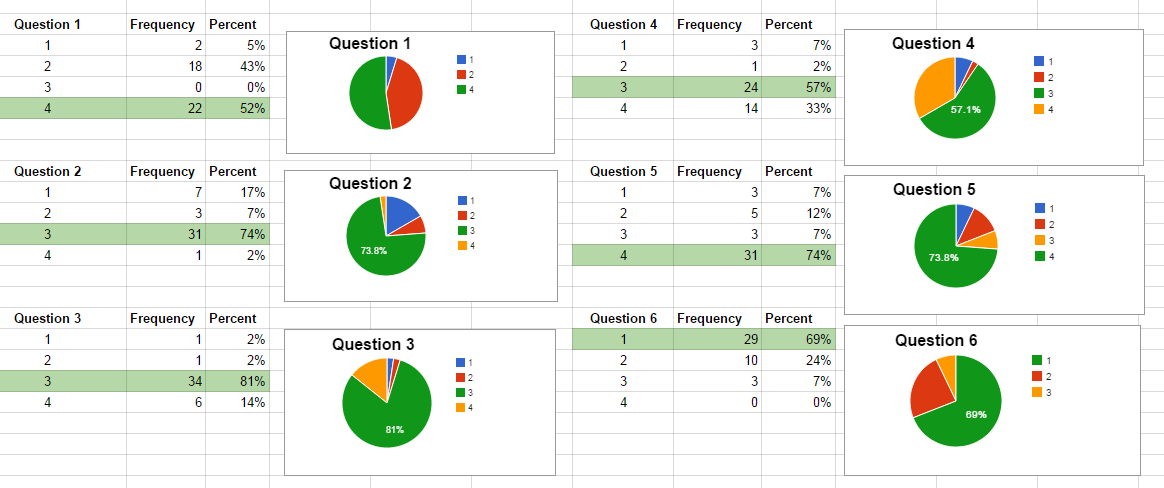
This leads me to believe that one of the issues we have with this data is that it has compressed the information about what students did to such a great degree that it is impossible to use the information meaningfully. All of the rich work students have done and what they have thought about has been compressed into a few numbers and consequently making decisions based on those numbers alone is incredibly difficult.
What can we do differently? One option is to consider hypotheses about why students may have actually chosen those multiple choice responses like the following. Again, the question itself is critical but at least this leads to some potential things to give feedback to students about.
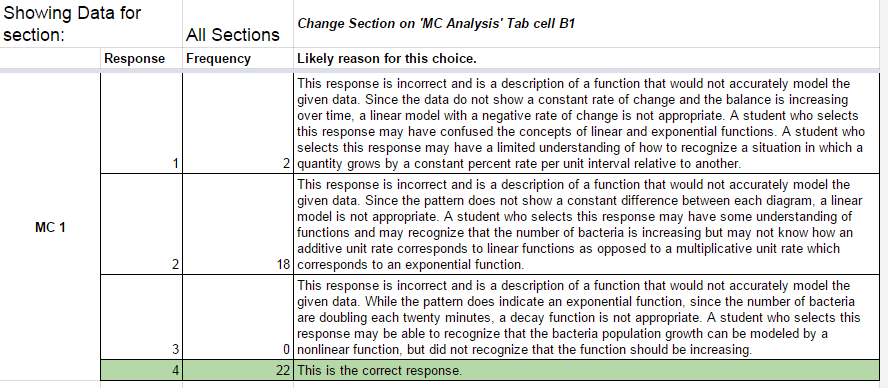
But these suggestions for what students thought about if they chose a response are just hypotheses. They are thought through from an adult’s perspective on the mathematics and these kind of analyses are rarely informed by detailed and thoughtful research into children’s mathematical thinking.
While multiple-choice questions are an inexpensive and relatively time-efficient way to gather evidence of student performance, they make it difficult to really capture the richness of student thinking. What, for example, do you think the student below was thinking about when they worked on this problem?
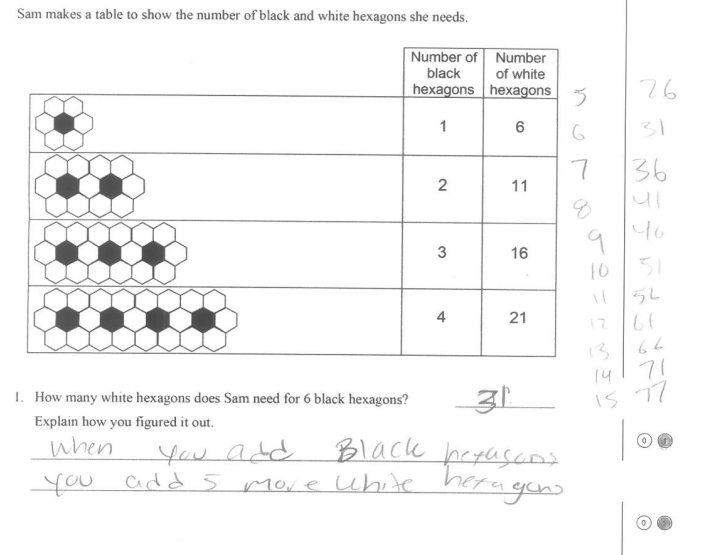
While it is clear that this sample of student work provides potentially powerful information, the challenge with looking at individual student work is it can be extremely time-consuming and challenging to study a variety of student work and come up with systematic responses to that group of students. We have to somehow combine the richness of information provided by what students actually did with a systematic approach so that we can approach teaching an entire classroom full of students.
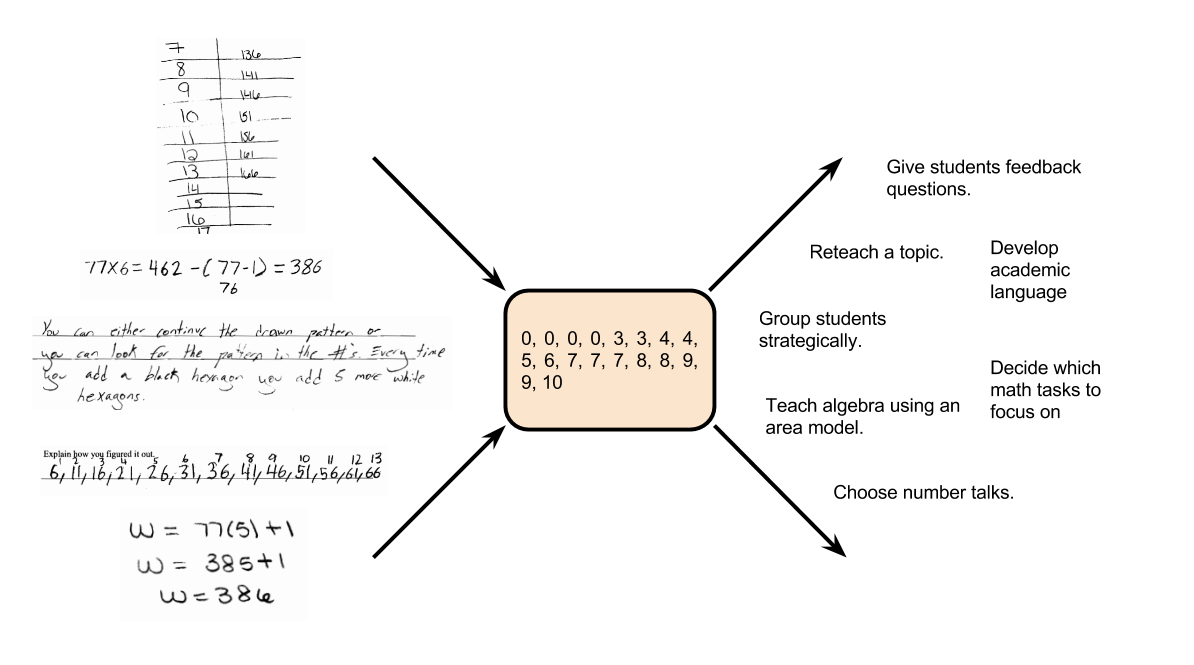
One approach we have used in our project to diagnostic assessment is to systematically look at student work and decide what approaches students took and attempt to group their work with other students who appear to have thought similarly. A teacher I know literally uses the desks in his classroom and spreads out all of his student work across the room trying to make sense of the different mathematical ideas students used. Other teachers record their interpretations of the approaches the students used in spreadsheets, like the picture below suggests.
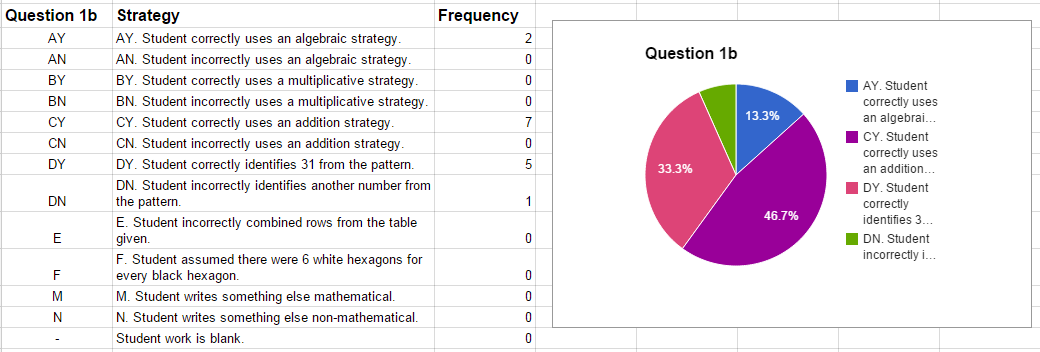
But still, no matter how we organize the information, the question remains, what do we do with it? A further challenge is, how do we use information on what we uncover about student thinking in a more timely fashion rather than after our class is over?
I’m going to suggest some approaches for both of these questions in a follow-up post, but I’d love to know how you respond to student data, both after the fact and during a class.
Timteachesmath says:
Here’s one activity I tried when confronted with a similar dashboard. Ignore the pass rate; instead of reteaching 2/3 of the material to 2/3 of the class, narrow the focus to just two questions. Students resist coming up with explanations for wrong answers or playing ‘find the mistake,’ because that’s never been a worthy goal during their answer-seeking academic careers. But it’s more tangible when they’re doing so on behalf of real people who choose those answers; how could someone sitting right next to them think so differently?
Without revealing the answer key (I might tell groups they got 1 right and 1 wrong), I’d divide the class into three groups. Students on lines 1, 2, 3, 5, 6, and 15 are going to explain why on Earth someone would put answer ‘1’ for MC2 and why someone would answer ‘1’ for MC6, and by ‘someone on Earth’, I mean the six people across the room. Students 3, 7, 8, 9, 10, and 14 are going to explain why someone would answer ‘3’ on MC2 and ‘2’ on MC6, and by someone, I mean the five people across the room. I’ll assist these groups while students 4, 11, 12, 13, and 16 are preparing to present their views on MC1 and MC4. Each group is justifying one right answer and one wrong answer whether they know it or not.
If I want to train students out of the habit of clicking on the first answer that sounds reasonable, sometimes we need to invest 20 minutes talking through one or two questions.
March 21, 2015 — 2:41 am