The Reflective Educator

Education ∪ Math ∪ Technology

Archives (page 89 of 97)

Connecting with other people

In the past 3 days, I’ve had 3 different people contact me and ask me if I want to participate in a study.  One is a Ph.D. student about to finish her doctorate, another is an IT director for a school district, and the last is a business student who wants some information about a product his group is hoping to build with teachers in mind.  Each of these messages was personally addressed to me and cited either my online activities as a reason for the contact, or my interest in technology.

I suppose that my willingness to blog about what I am doing and share my resources has made me easy to find.  Perhaps anyone who is blogging and a strong online presence is going to be found in this way.  Anyway it has made me think about an online presence and its value.

The past week my wife has been in Mexico with my son, and every day we’ve been video chatting via Skype.  It’s amazing how powerful this experience is, and how happy I am that I am able to connect with both of them and see their faces.  It makes a difference.  Now I know that video conferencing with loved ones abroad is nothing new, but I’m including it as an example of how people are connecting today.

Another example.  A friend of mine is looking for work, he contacted me through Facebook and asked if I had any contacts.  Turns out, I do, and I shared them with him.  My friend is 9 hours away via timezones, this kind of interaction is very difficult to do via telephone but it worked really smoothly via the inbox and wall of Facebook.

I’ve heard it said that our reliance on technology for connecting with people has reduced the amount of face to face interactions we have.  They are probably right.  It has dramatically improved our ability to connect in so many other ways though, I think a bit of a loss in F2F time is worth the ability for me to see my son via Skype in Mexico, or for 3 professionals to connect with another professional and ask for his support in their personal projects.  

Update:

Here’s a TED video that describes a similar issue.

Removing the option to remove clothing in the Hippo Viewer for OpenSimulator

The OpenSimulator is great, but unfortunately it was written for adults in mind.  One of the options available all over the place is "Take Off" which basically means to take off the given item of clothing.  This means if install this program as is on your school’s servers, you just installed something which allows students to view porn on the school’s computers.  Ouch!

Fortunately there is a solution.  The Hippo viewer uses a series of XML files to create it’s menus.  If you go into ‘C:\Program Files\Hippo_OpenSim_Viewer\skins\default\xui’ (or a similar location based on where you installed the program and what operating system you are using) you can find the XML files which define the menus.  Simply go through them (use find "Take Off" in your text editor) you can safely remove all of the options for removing clothing from every menu. Whew, lots of work, and easy to mess up, but at least it works.

Before you make any changes, make a backup of your installation (just make a copy of the whole program with extra files somewhere else on your computer, like in your ‘My Documents’ folder).  Basically to get this to work you have to find the folder ‘default’ in C:\Program Files\Hippo_OpenSim_Viewer\skins and replace it with the contents of this zip file.  You also want to delete the ‘Silver’ folder from the skins directory so the students can’t switch to a theme with the buttons we don’t want.  Note that if you upgrade this program, you’ll have to repeat these steps.

It’s not foolproof, but it seems to be very stable and I have happily tested that the buttons and menu items which let users remove their clothing are now gone.


OpenSimulator and the possibilities for Education

So I downloaded OpenSimulator, which in case you didn’t know, let’s you build virtual 3d worlds, much like Second Life.  You can view these virtual worlds using the open source Hippo Viewer, which basically acts as a way to view the data in 3D from an OpenSimulator server.

Installation is relatively straight forward if you follow this tutorial or just download the installers from the sites above.  I had to play around with some of the configuration settings, which involves some Googling and a willingness to open up a file and make some small changes.  It wasn’t too hard, but it’s considered Alpha software so you get what you paid for in this respect.  It took me about 45 minutes or so to get it set up and running once I had it downloaded.

Here’s a brief video example of what it looks like:

So having installed this, some ideas immediately sprang into my head as to how it could be used.

  1. Students could learn about perspective (in Art or Math) by building 3D models and examining what the view of the models look like from different camera directions.
  2. If you set up a multiuser version (known as a Grid) instead of the standalone version, students can edit terrain together.  They could rebuild a historical landmark together in Social Studies, or view existing models by importing them into the server.
  3. Students can edit the basic 3D shapes and learn about transformations of objects.
  4. The entire world is built on a 3D coordinate system so as students build their world, they will learn about mapping in 3D Cartesian coordinates.
  5. Students could learn about architectural design
  6. There is a plugin for Scratch which lets students create scripts to control animations in the Hippo Viewer (which unfortunately I can’t find anymore).

The first advantage I can see to using this system over Second Life (which admittedly is much easier to install) is that you can control exactly who uses the system.  It can be your class, a student, each student is on their own server, whatever, but you have complete control.  The second advantage I see is that it is much cheaper to build and create things, rather than having to spend money on land in your virtual world.

A disadvantage I see is that the server which runs a world for a classroom of students is going to have to be pretty decent.  This could definitely be a problem for schools which don’t have their own infrastructure.  On my own computer the server runs absolutely fine with multiple other programs open, but I have 4G of RAM and only 1 person using the server (me).  I’m not sure exactly how much memory each client uses when they connect, but I can imagine it’s not small.

Anyway, this is definitely something to consider.  I may use it when we look at perspective, but I’ll have to see if I can install (and run) the standalone version of the program on one of the school’s desktop computers successfully…

Update:  Oh and one classroom management thing. You might want to create a rule about the clothing of the avatars as I have yet to figure out how to disable their removal by the students…although see this post about removing the problem all together.

OPML file for the 2009 Edublog awards

A few weeks ago the final results of the 2009 Edublog awards were announced.  I looked around for an OPML file, which is basically a way to import and export RSS feeds from your feed reader.  Long story short, much searching, no file found.

So I took the page that Edublogs published with all of the nominations, wrote a script in PHP to parse the page and find the links to the individually nominated blogs, and then extracted the RSS feed for each page.  Finally I used an online service to generate the OPML file, since I didn’t want to manually add each feed.  I tested the import in Google reader, and over 340 blog feeds were successfully added.  Pretty cool.  During the process a few blogs were lost, and I removed the Twitter feeds.

Anyway, here is the OPML file (I’ll get a better version up soon, the last one had a few wikis and Ning activity feeds, not as useful), which you can download and import into your reader.  I recommend not attempting to actually follow ALL of these blogs, but you could spend an afternoon and filter the list to what you actually find useful.  Caution: You will end up with THOUSANDS of unread posts so be prepared for some sifting afterwards.  I’m currently in the middle of going through each of my subscriptions and scanning the blog posts to make sure they are interesting/useful.  I’ve noticed a fair number of feeds of Wikis, which to me is pretty useless if you aren’t involved in creating the wiki.  Stay tuned, and I’ll export my final OPML file and share it here.

Perhaps someone could export definitions for each of the categories of blogs created by Edublogs?

Update: The trimmed version of the OPML file, suitable for an ed tech junkie with an interest in Math or Science education. Just save it to your computer, then import it into your feed reader.  Be warned, I follow A LOT of blogs.

An overview of Google reader

Here is a brief overview of Google reader.  If you aren’t sure what a reader is, or what it is for, you should really watch this Common Craft on RSS in plain English first.

Link:  
 

Screen-shot:


Summary:
Google Reader is an application which lets you pull information to you rather than searching for information on the web.  Blogs, newspaper, even Twitter, publish links called feeds which you can use to subscribe to their services and they will push information to you.


Purpose: 
This application is a way of reading information online using syndication.  It’s much like having online newspapers delivered to you, rather than searching for the newspapers in the shop.

How this can be used for professional networking:  
First you search for blogs written by teachers.  One easy source is to go to http://edublogawards.com/ and subscribe to all of the nominees of the blogs.

How this can be used in the classroom
:
Students can also search for and find blogs and other feeds to follow.  On a regular basis they will be pushed information.  As well, students can subscribe to each other’s blogs and have a single place to read all of the comments and posts from their peers. A classroom could have subscriptions to a number of sources, and you could share the posts with the class as a current events section or something similar.

Advantages of this application

It’s easy to use, it has a number of straight forward features, such as the useful ‘recommendations’ which are other feeds that Google thinks you should subscribe to, based on what you have already found.  It is also nice because it has a single sign on with other Google applications, and finally, there are nice applications for mobile browsers, so you can get your feeds on the go. Finally, Google reader also works when you are offline using Google Gears, which means that you can download your feeds when you have a connection and then read them when you are offline.

Disadvantages of this application
:
This application has no serious disadvantages that I can think of, except that finding the subscriptions in the first place can be a tricky.  I find the interface fairly easy to use, but I could imagine it could be a bit daunting for someone who is just getting started.

Similar tools: (if applicable) 


The value of homework

So I was at a dinner party last night, and was the only high school teacher in a room of university students and academics.  It was quite an enjoyable night, and I got to reconnect with a bunch of old friends.

Of course as a teacher, eventually the subject of what I do for a living comes up.  It’s pretty clear that everyone has an opinion of good and bad teaching. I made the declaration at one point that I no longer assign typical math homework.

Actually it’s true, I haven’t assigned a problem set from the textbook this entire school year.  This is a conscious decision, not me just being forgetful and a real reason behind based on research.  I do assign other types of homework occasionally.

I read something in the summer that changed my perspective on homework.  It was about the value of feedback when learning. I don’t remember the exact title of the article, it was in my course readings.  In any case, what the authors of the study discovered is that the length of time between when you make a mistake and when you get feedback on that mistake makes a huge difference in whether or not you remember either the correct material or the incorrect material.  

If you make a mistake and get feedback within a few minutes, chances are pretty good you’ll remember the feedback rather than the mistake.  As time goes on, the probability you remember the mistake instead of the feedback increases.  If it takes more than a day or so to get feedback on your mistake, chances are pretty good you’ll make the mistake again and forget the corrective feedback you received.

The implications of this in assigning student homework is pretty easy to see.  If I assign to be done Monday night, and some of my diligent but struggling learners do the homework that night, then I see the students on Wednesday, chances are pretty good that there’s very little I can do to correct the misunderstandings of the students for that assignment.

So I’ve stopped assigning homework which doesn’t give immediate feedback.  I’ve discovered dozens of websites which offer free online quizzes which are marked immediately and display the correct answer for the students.  Assistment.org is especially good, it gives hints on how to solve the problem as they go wrong and keeps track of how many hints each student makes.

There are other types of homework you can assign.  Anything which forces the students into a state of active engagement with their material is good.  This could mean internet research and summarization, gathering curriculum resources, creation of online tutorials, extended project based work, etc…  The analogy here is, what types of things do you do as preparation for school?  These types of tasks are also appropriate for the students to do.

Do what your students want to do

So something I’ve noticed recently is that my classes have been going really smoothly.  Actually, every class now I have nearly no classroom management problems and every students is engaged for nearly the entire class on their work.  I don’t think I’m doing anything tricky, I’m just doing what the students want to do.

Imagine this box represents all of the possible learning activities you could do in a classroom.

Rectangle

Now imagine that you draw a circle inside the box to represent all of the activities your students want to do.  Note: Diagram not to scale.

Rectangle with one circle

Now we draw a circle which represents the portion of the possible educational activities you want to do and which are relevant for the topic area you are facilitating or teaching.

Rectangle with overlapping circles

All you do is choose a learning activity for class which occurs in the intersection of the two circles shown in red.  In my experience this includes any activity in which all of the following three criterion is met:

  1. The students get to create something or interact with the material more deeply.
  2. The students see the point of the activity.
  3. The students are engaged at a higher level on the pyramid of learning.

Some examples of activities which qualify include, but are not limited to:

  • Students tutoring each other
  • Creating video tutorials or podcast tutorials
  • Projects based on the real world applications of what you are teaching
  • Student led interviews with professionals in the field
  • Student generated quizzes, worksheets, tests, etc…
  • and more….

What I’ve also noticed over time is that the intersection gets a bit larger as the students see a trend: they are doing fun, relevant and engaging activities all the time.  They will tend to more willing to do other activities because they spend most of the time in your class engaged, so they will jump in and focus on activities which they may have otherwise enjoyed less in a non-interactive class.

Paper use in schools

So a while back I posted a link to an survey I conducted.  I didn’t have an enormous amount of respondents, but I’ll share the results with you.

First it should be noted that there is some selection bias.  Actually probably LOTS of selection bias, given that this survey was conducted entirely online and that people who read this blog, or found the link to the survey through Twitter are probably pretty IT savvy.  That being said, you might still end up being surprised with the results.

There were two questions on the survey.  

1.  How many sheets of paper (approximately) do you use in a day?
2.  How many teachers do you have in your school?

The lowest answer to the first question was 1 single sheet of paper a day (good for you!) and the highest was 75.  The lowest answer to question number 2 was 6 teachers and the highest was 170.  The 11 respondents used a total of 326 sheets of paper a day, or just over 26 sheets each.  Probably this is pretty good, I would expect that a typical teacher probably uses more.

According to these results, a typical school in which these respondents work uses about 2000 sheets of paper a day, or about 360,000 sheets in a school year.  Of course there are thousands of schools in Canada and the US (where most of the teachers who responded probably live), 96,000 or so in the US (or 120,000 depending on who you believe) and this means that more than 34 billion sheets of paper are used each year just in the United States.  Assuming that each sheet costs a mere 5 cents (photocopy paper at Office Depot apparently costs 38 cents) a sheet, then to provide paper to every child in the US each year for school costs about 2 billion dollars a year.

For comparison, providing each child in the US with a $100 laptop (recently available on the market) would cost about 8 billion dollars assuming even the little kindergarten children get one.  In other words, we could pay for a laptop per child in the US in 4 years by stopping using paper in schools.  Oh and that laptop can also replace the paper…

Of course if the people surveyed are far from standard, then maybe schools actually use twice as much (or even four times as much) paper, in which case the amount of time it would take for the savings from not using paper to turn into laptops would be reduced to half (or even a quarter) of the time estimated.  In other words, we could potentially turn billions of pieces of paper into every child in the US having a laptop.

Now I’m using US numbers here for this calculation (because the supporting figures are easier to find) but it shouldn’t take you long to realize that this is probably true of any industrialized nation with similar expenditures on paper.  Perhaps we can use some financial arguments to persuade our legislators to put some good tools into the hands of our students?

Personal Learning theory revisited

I personally think people learn through an unconscious process called experiential learning.  They hypothesize about how the world should work, collect data, compare the data they have collected to see if it fits in their theory, and then revise their theory if they feel enough evidence has been found.  In this theory, as described by Kolb (1984), people construct an understanding of the world around them using what they know as a basis.

Each piece of knowledge people gain has to be fit into their personal hypothesis.  At first, people will "bend" their hypothesis to make facts fit which seem inconsistent, but eventually if enough contradictory data is collected, people are forced to revise their ideas.  This is part of the reason why students have so much difficulty learning topics for which they do not have any background; they are constantly required to create and revisit their hypothesis, and to build theories about the information they are receiving "from scratch".  "Ideas are not fixed and immutable elements of thought but are formed and re-formed through experience." (Kolb, 1984)

It is crucial during this process that the learner feels comfortable to make mistakes.  Although it is possible that an individual learner will have a theory which fits all the facts as they are collected, it is much more likely that conflicts exist between their theory and the data.  As the Lewinian experiential model suggests, observations of what one has learned or not learned are a critical aspect of the learning process (Smith 2001).

As drawn from the work of Vygotsky, situated learning suggests that "experience in the activities of the practice" (Kolb, 2005) are integral to the learning process.  Without learners being embedded within a community of practice, their ability to make connections, draw conclusions, and verify hypothesis will be greatly hampered.

References:

Kolb, D.A. (1984). Experiential Learning: Experience as The Source of Learning and Development, Case Western Reserve University, retrieved from http://www.learningfromexperience.com/research-library/ on December 2nd, 2009

Kolb, D.A., Boyatzis, K.E., Mainemelis, C. (2000). Experiential Learning Theory: Previous Research and New Directions, Case Western Reserve University, retrieved from http://www.learningfromexperience.com/research-library/ on December 2nd, 2009

Kolb, A.Y, Kolb, D.A, (2005) Learning Styles and Learning Spaces: Enhancing Experiential Learning in Higher Education, Academy of Management Learning & Education, 2005, Vol. 4, No. 2, 193–212. 

John-Steiner, V., Mahn, H. (1996). Sociocultural Approaches to Learning and Development: A Vygotskian Framework, Educational Psychologist, 31(3/4), 191-206, retrieved on December 2nd, 2009

Smith, M. K. (2001) ‘Kurt Lewin, groups, experiential learning and action research’, the encyclopedia of informal education, retrieved from http://www.infed.org/thinkers/et-lewin.htm on December 4th, 2009


Integration in the real world

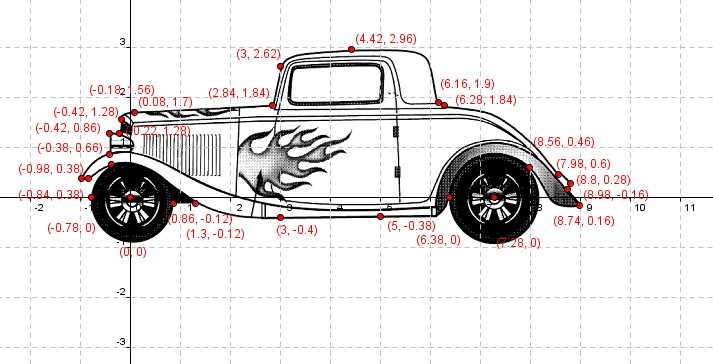
I’m working on a simple project to explain to students the importance of learning integration (which is an important technique in Calculus).  The basic idea is this, take a model of something from the real world, like a car for example, and find the area represented by the model.  You can talk about the importance in figuring out how much the metal will cost to make the car, or how much paint is required to cover the car, etc…

Here’s how we are going to do it in my class.

First we use our friend Google Image search and find a model.  I found some great models from http://carblueprints.info and settled on a 1931 Ford Window Coupe as an example.  It’s not clear to me what license these images are under, but given that I am using them exclusively for educational purposes and that there is no commercial value in what I am doing, I’m probably okay to use them here.

Once I had an image, I cropped it down somewhat and resized it.  This was to make it more convenient to embed in my favourite graphing program, Geogebra.  You could very easily use any graphing program here, or even print out the image and do the rest of this project on paper.

The next step was to open up Geogebra and insert the image.  Lots of tutorials on how to do this and push the image into the background, and of course the steps will vary depending on which program you use.  Once I had the image in Geogebra, I added points around the edge of the image at the critical parts of the model.  I basically want to split the edges of the model into the different functions.

Once you have the coordinate point, which are the difficult things to find really, you can now use all sorts of techniques to find the functions.  For example, which a less advanced class, they could approximate the shape given using straight lines.  For a more advanced class, they could use lines, circles, polynomials, whatever to find the functions which represent the shape of the curves.  

One nice option here is to either use the regression tool on a graphing calculator, or available in Excel to find the functions as appropriate.

Once you have the many functions which represent the shape, the students will have to find the x bounds of the functions (which should be easy if they have recorded the coordinate points) and then integrate each function over the appropriate bounds.  One thing that could get students stuck at this stage is remembering that if they actually want to find the area ABOVE the curve, they will need to either flip their function over the x-axis, or more easily, find the absolute value of their negative answer for the integration of that function.

This activity allows for all sorts of differentiation (in terms of pedagogy, not calculus!) as well.  Students who might struggle can be encouraged to choose easier models to begin with.  You can also point out that some areas of the shape might be better done using actual area formula instead of integration or potentially this same type of activity could be used at a much lower level of mathematics using just area formula.  These models represent excellent examples of composite areas, and their realism will help students recognize the relevance of what they are learning.

I haven’t actually gone through the entire process of the integration itself.  I’m going to be using this activity with my students today and I don’t want to give it all away yet!  Wait for me to post some examples of their work when they finish.