Act One
Show this video. Ask students what questions they have.
Act Two


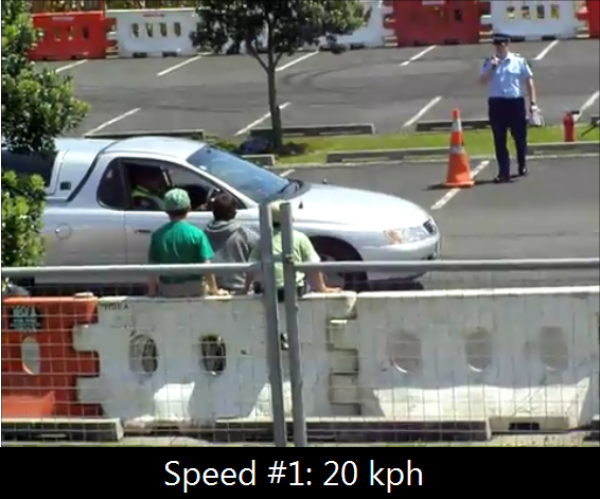
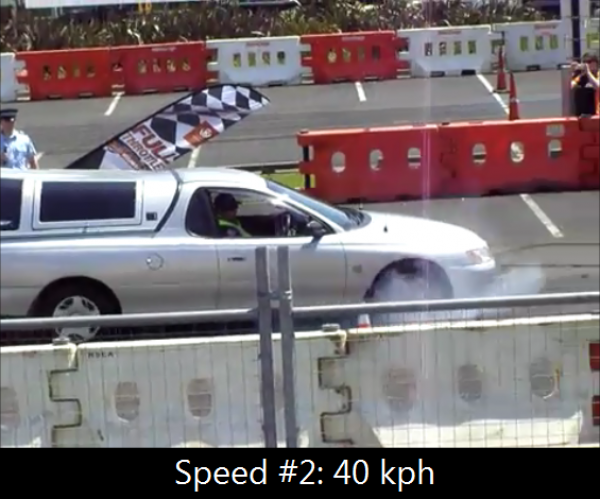
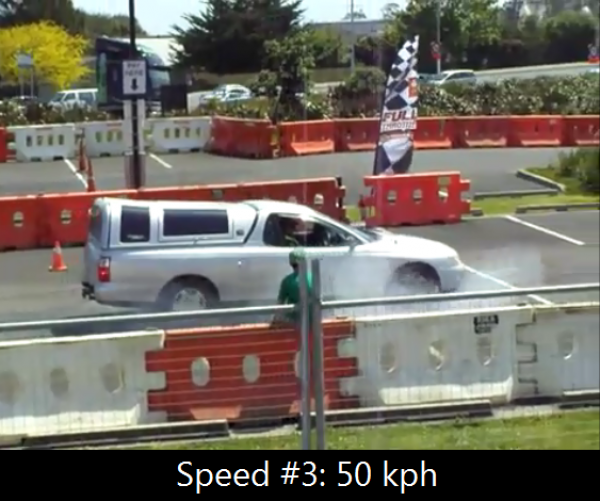
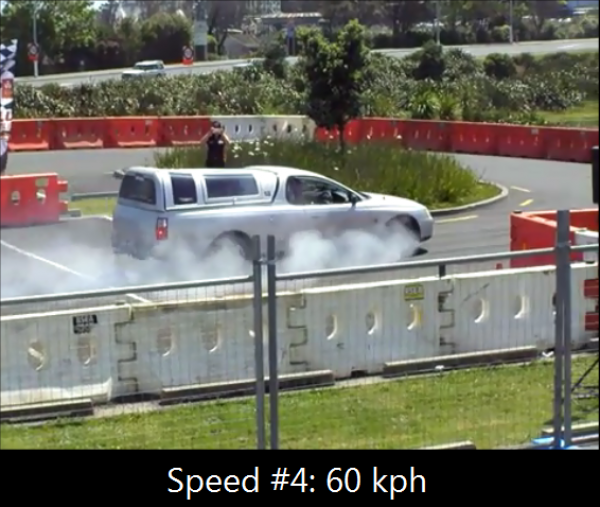
Give the students these photos. From these they should be able to figure out the distances travelled by the car, but you may wan to point out those handy reference points in the background (hint: the parking spots).
Act 3

I don’t know exactly what Act 3 should look like. Would a graph make the most sense? A function in standard form? Would an image overlay of the car in all four positions work the best (I don’t have the tools to make this on my current computer)?