Here is a graph of the spending on education in public K to 12 schools in the US compared to the spending on education outside of K to 12 schools from 1950 to 2007. The data is from this site thanks to @jasonflom. Please comment below if you see an error in my math.
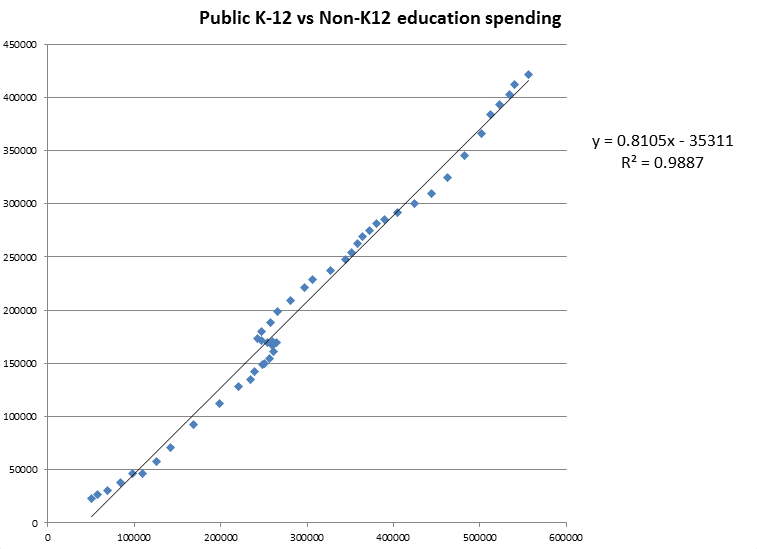
So what this graph shows is that there is an incredibly strong relationship between the money spent from all sources on public K to 12 education in the United States and the money spent from all sources on all other education in the US. Since the funding for sources outside of public K to 12 education have very different funding sources we know that this funding situation is not a function of federal or state policy.
In other words, since funding for education has been increasing regardless of the policy behind the funding, it must be that the education just costs more today than it did years ago. Some obvious reasons for this are that the technology in schools has changed over the years and costs more and land costs have risen above the cost of inflation.
Republic of Mathematics says:
David,
i am having trouble understanding the last part of your last sentence: ” it must be that the cost to education must just be more expensive.”
Can you elaborate for a bear with a small brain?
Also, I am not convinced that “Since the funding for sources outside of public K to 12 education have very different funding sources we know that this funding situation is not a function of federal or state policy.” I would have that that very similar policy concerns would have driven both federal/state education funding and private education funding. It would surprise me if spending from these sources were not very highly correlated.
Am I missing something?
October 29, 2010 — 2:26 pm
David Wees says:
It’s not my clear to me that the policies are similar in different states or between the public and private sectors, in fact shouldn’t we see similarities in policy but generally there should be a very wide range of different policies across a country the size of the United States. The fact there is such a strong relationship between the different costs suggest to me that are outside factors which are influencing the costs, rather than policy.
I’m trying to refute the argument that policy alone has led to the increase (in absolute dollars) in the cost of the public K to 12 school system.
October 29, 2010 — 5:16 pm
Anonymous says:
Some obvious reasons for this are that the technology in schools has changed over the years and costs more and land costs have risen above the cost of inflation.
It could also be that since the government makes more money available, more can be spent. What do you think would happen to the price of cars if the government gave everyone $2,000 dollars to buy a car? You give people money and they’ll find some way to spend it, especially if the incentive is to use it or lose it, and lose it for next fiscal year, too. I see it as a vicious circle (perhaps virtuous in some cases): the more you spend, the more you get to spend. It’s doesn’t follow that you needed to spend that to get the results you did.
November 1, 2010 — 7:33 pm
David Wees says:
I have definitely seen that phenomena as well and it would cut across public & private sectors as well. Again, it would not mean that it was an effect of policy, but more an effect of human nature. We are bound to use all we have, plus a little bit more.
November 1, 2010 — 9:49 pm