I’m very excited as this will be my first year using experiential assessments as an end of year task. Every year before this I have been required to produce a "final exam" for each of my subjects, while for the past three years at least I have known the futility of measuring students ability accurately with a single exam. The school I work at is still in the early stages of adopting experiential exams, but they have had them running for at least one year with success.
The basic idea is, the students get given a final task to complete, which is a cross-disciplinary assessment of what the students have learned how to do this year. The objective is that a few subjects get together and find a common guiding question for their assessment. Teachers from these subjects work together to create a task which can be assessed using their own criteria from each subject. We’ve chosen to break the task into pieces for each subject, but ideally there should be one complete task for the student to do.
Here are some examples, which I can finally share because the students have been introduced to the tasks themselves (and so they are no longer a secret). I have to tell you, I have been waiting to write this blog post for more than a month! Note that the students will have several hours to complete these tasks, broken up into 4 or sometimes 5 blocks of time.
 In the 9th grade, our guiding question is, "How as Imperialism affected our society?" and we are looking a specific focus of Central and South America and the colonization of those parts of the world. In Mathematics, my task was, "Determine how much sugar could a galleon carry?" which was relevant because sugar is an example of a trade resource upon which the colonies depended. Here is the task sheet I provided to the students. You can see that the task is open-ended, that there is no one specific solution, and that what I will be grading the students on is the process they will be going through. The task also involves a wide variety of mathematics from the year, and I can generally assume that if the students are unsure about how to include a specific piece of mathematics, then they didn’t really get it.
This is also the kind of task that students might actually find interesting. In the creation of their diagrams to help explain themselves, there is a large amount of creative license which can be applied. When the students decide on their assumptions, which they have to justify, they can have all sorts of wild assumptions, provided there is some reasonable basis for their assumption.
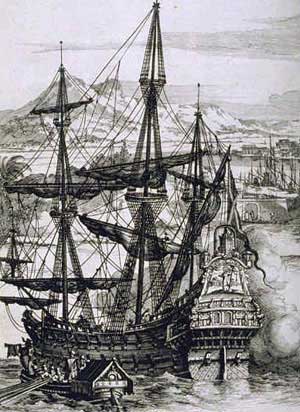
Galleons are also pretty cool. They have been popularized by movies like Pirates of the Caribbean, so the students are very likely to have some personal idea of what they are like. The photo shown here is from the Wikipedia article about Galleons, and is licensed under a Creative Commons license.
This type of task also lends itself well to differentiation, as the students who wish to present more of their knowledge and understanding can take into account more factors which could affect the amount of sugar these Galleons could hold. For example, the sugar to be transported would almost certainly be done so in as water-tight barrels as the merchants could find.
 In the 10th grade, our guiding question is, "How do we best get our voice heard? Is it through Science, Math, or Language?" We start by gathering evidence in all three subjects, specifically on the environmental effect of large multinational organization policies can have on small impoverished countries. We complete our week with a trial, in which students will present their scientific or mathematical evidence to their teachers. They will also role-play either French speaking or Spanish speaking people’s of said countries (we originally said that this case was a comparison of the Dominican Republic and Haiti) who have been affected by the multinational organization.
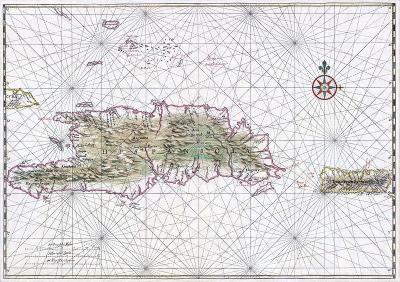
Image on the right is of the island of Hispaniola and is from a Wikipedia article about said island. It is also licensed under a Creative Commons license.
I’ve collected some data sources, through my contacts on Facebook actually, and will share these sources with the 10th grade students as a starting place. The best part is, most of the data is largely unprocessed, which means the students will have to do this themselves! In mathematics, the objective is to analyze the data and depending on whether they side with the multinational or the local population, build a case to present in the trial. Here is a copy of the task sheet we provided.
The day after the trial, students reflect on their contribution in each subject and we wrap up the trial with some conclusions. It will be really interesting to see what results.
I’m pretty pleased with the design of our experiential exams this year, and I’ll talk more about how well they went after I’ve finished this week, which looks like it will be extremely busy.
Nick says:
Those look amazing!
This is the second year I’ve done final projects, in combination with final exams, in my Algebra 2 / Trigonometry class. Students show that they can use the skills they’ve learned to investigate new topics on their own or build a coherent and compelling summary of a unit. However, these are still isolated from students’ other classes and in some cases from using math in real-world contexts.
I really like the fact that your experiential assessments are being combined across multiple subject areas! It allows students to see the interconnectedness of those areas. One question: do all 9th /10th grade students at your school take the same subjects, or do students complete different tasks depending on courses (but all directed toward the guiding question)?
June 1, 2010 — 2:28 am
David Wees says:
Our school is very small, so all 9th or 10th grade students take the same core subjects, and either French or Spanish. They have 2 elective subjects which have chosen not to do summative assessments so that the core subjects have more time to run their assessments.
Yes, I agree it is harder to see the real life context of a problem which is based entirely in Math. Being able to see that one subject connects to another is pretty cool. I kind of take it for granted sometimes because it is a core value of the IB Middle Years Program we run.
June 1, 2010 — 9:03 am
Stephen Lazar says:
I’m at a small school in our sixth year – it’s always been our goal to be doing this type of assessment as an ongoing part of our school, but we’ve never quite gotten there. I’m going to share this with my team for next year to see if maybe next year could be the year.
June 1, 2010 — 7:48 pm
David Wees says:
I heard that we modeled our experiential summative exams on what Appleby College does for their end of year assessments. Could be useful to seek some information from them. http://www.appleby.on.ca/
June 1, 2010 — 8:13 pm