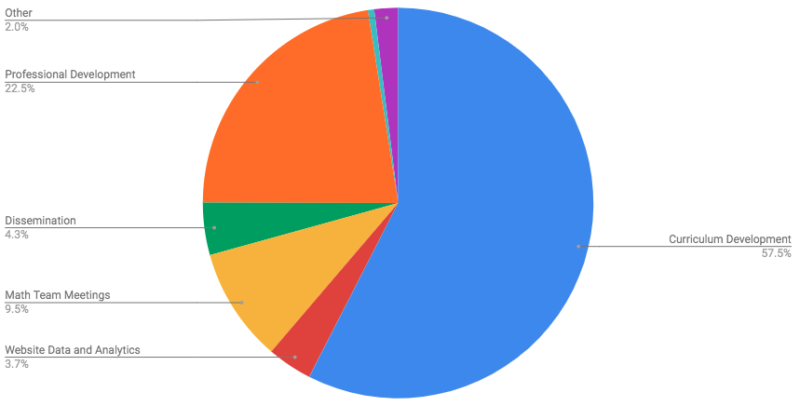
The last two years I have been working for New Visions for Public Schools, mostly remotely but with some trips to New York City to run workshops and do school visits. During that time, I’ve kept careful track of the work I have completed as you can see above.
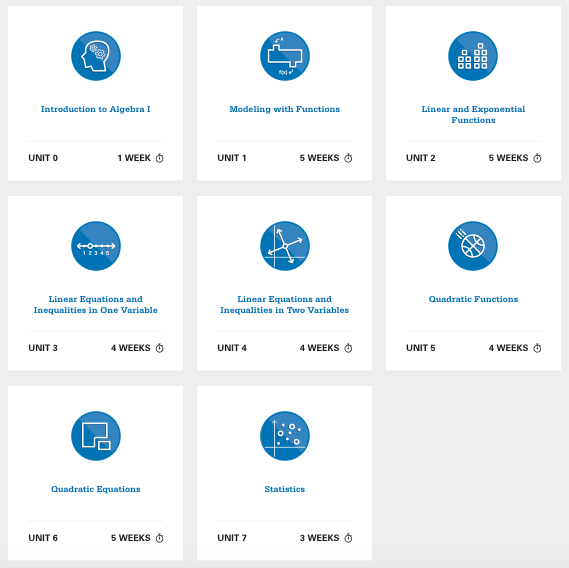
With my colleagues, we completed an Algebra I course which includes:
- 5 videos to support specific instructional strategies
- 7 formative assessment lessons
- 8 units and 7 unit plans
- 7 initial tasks, 7 end-of-unit assessments
- 10 videos of instructional routines enacted in the classroom
- 24 Big Ideas
- 123 tasks to support instructional routines
- 125 interleaved, spaced, retrieval practice assignments
- 138 pages of notes for teachers
- 664 pages of student-facing materials (link 1, link 2)
- An add-on to help manage 1200 typeset Regents problems
These resources were built with support for multilingual students and students with disabilities baked in. We read and incorporated cognitive science in the development of these resources. We released all of these resources under a Creative Commons license so that teachers could feel free to download and adapt these resources for their students. In order to support teachers in using this curriculum, I personally spent over 650 hours preparing and enacting workshops for teachers over the last two years.
My work with New Visions is wrapping up soon and so I am reflecting on the work we completed. I regret that our Geometry and Algebra II courses are not yet done, but I feel pretty proud of what we accomplished together regardless.