Education ∪ Math ∪ Technology

Year: 2013 (page 6 of 15)

The Faulty Logic of Disrupting Class

I am reading Disrupting class, by Clay Christensen, Michael Horn, and Curtis Johnson. In the introduction of Disrupting Class, Clay Christensen, et al., give six possible reasons for why the United States education system does not appear to be doing well when compared with other OECD countries:

  1. Schools are underfunded,
  2. There aren’t enough computers in the classroom,
  3. Students and parents are to blame,
  4. The U.S. model of teaching is broken when compared to other models in other countries,
  5. Teachers’ unions,
  6. The way we measure schools’ performance is fundamentally flawed.

Unfortunately, this is a good example of how the question asked frames the answer (Question asked: Why isn’t the United States doing better in education compared as a whole to other OECD countries?).

When you compare the United States education system as a whole to other OECD countries (using PISA data, for example), you find the United States appears to be in about the middle of the pack. However, if you disaggregate PISA data and look at a state by state comparsion, and then compare each state to other similar OECD populations (in terms of average income), you find quite a different story. The high income and low income areas of the United States hold their own against comparison OECD countries. but the United States has a much higher poverty rate than most OECD countries, which results in an over-representation of low-income students in the aggregate U.S. data.

We know that all students can learn, when they are given the supports they need, so a better question for Christensen, et al., to ask is; why isn’t the United States doing more to combat the effects of poverty on its most vulnerable population?


Other notes:

In chapter 1, Christensen, et al., use the idea of multiple intelligences and learning styles to suggest that it is incredibly challenging for a teacher in a classroom to succeed at teaching all of his/her students. Unfortunately, recent research on learning styles and multiple intelligences suggests that they are not a useful framework for understanding student learning (except that all students probably benefit from experiencing ideas in different mediums).

In chapter 5, Christensen, et al., make the claim that their calculations show that by the year 2014 student centric learning (aided by technology) will become mainstream. The authors of Disrupting Class should probably have talked to teacher colleges before writing their book, where training teachers to use student centric approaches has been mainstream for decades.
Introducing vocabulary in a digital book

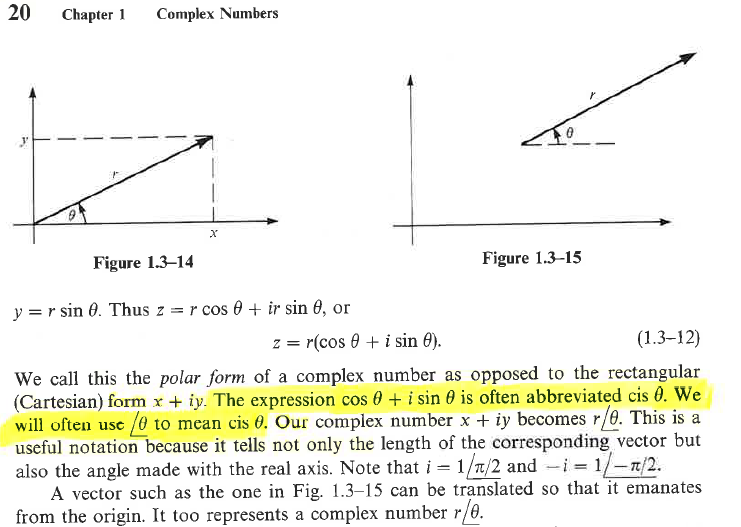
Example from Complex Variables textbook

(Source: Complex Variables with Applications, Second Edition, A. David Wunsch)


I started transporting my professional books to my new office this week, five books at a time. One of the books I brought today was my old textbook from when I took Complex Analysis in university, about 20 years ago. I decided to skim through the book to see how much of those two courses I remember, and as it turns out, the answer is not much.

I stumbled upon this notation that I was unfamiliar with very early on in the textbook, and decided to work my way back through the textbook to see if I could find out where this notation was introduced, and found the only reference to a definition of the notation above.

It occurred to me that this is not so much a failure of the author, but a failure of the medium, and one that could be addressed in a digital medium much more easily. One cannot easily link to notation, especially notation used often in a traditional textbook, back to it’s origin. However in a digital textbook every single instance of this notation could be made linkable (perhaps in an unobtrussive way so as not to be distracting) back to not only the first instance of the notation, but to carefully constructed examples of the notation in use.

On a related note, in my classroom, I try my best to introduce vocabulary and notation as it is needed to describe mathematical (or otherwise) objects that the students have been gaining some familiarity with. This way the vocabulary or notation is meeting a need; labelling something that we want to discuss, rather than being artifically introduced "because we will need to know this later."

Algebra with words, symbols or a computer

"If some one say: "You divide ten into two parts: multiply the one by itself; it will be equal to the other taken eighty-one times." Computation: You say, ten less thing, multiplied by itself, is a hundred plus a square less twenty things, and this is equal to eighty-one things. Separate the twenty things from a hundred and a square, and add them to eighty-one. It will then be a hundred plus a square, which is equal to a hundred and one roots. Halve the roots; the moiety is fifty and a half. Multiply this by itself, it is two thousand five hundred and fifty and a quarter. Subtract from this one hundred; the remainder is two thousand four hundred and fifty and a quarter. Extract the root from this; it is forty-nine and a half. Subtract this from the moiety of the roots, which is fifty and a half. There remains one, and this is one of the two parts."

~ Muḥammad ibn Mūsā al-Khwārizmī (Source: Wikipedia)

The tools for doing algebra have evolved over the years. When Muḥammad ibn Mūsā al-Khwārizmī was working on algebra, he did all of his work in words (see above). The symbols we have invented are a different tool we use for solving algebra problems. The fundamental structure of algebra is therefore something different than either of these tools.

Can we do algebra with a computer (which is today’s new tool for doing algebra) and preserve the underlying qualities that are algebra? How does access to a computer, and knowledge of programming, change what we can do with algebra? 

Negative attitudes about math

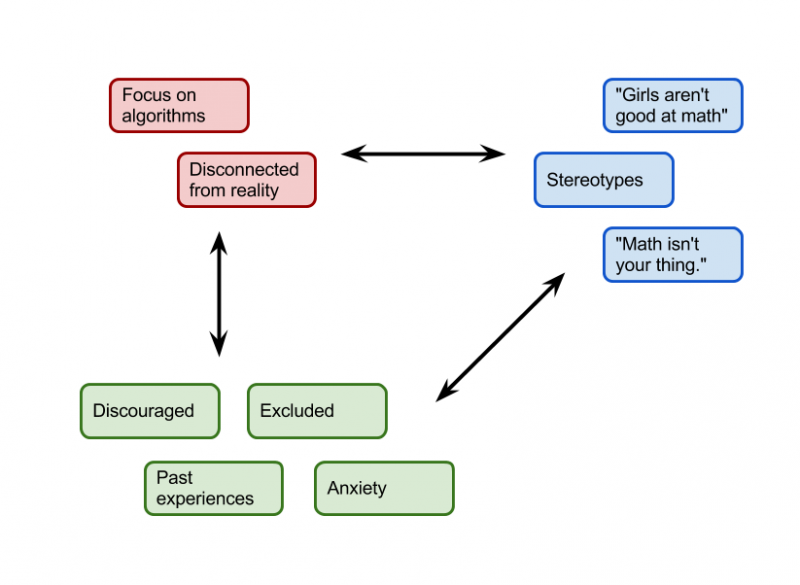
Attitudes about math


No one is born hating math. Our attitudes about it, positive or negative, are a result of our culture, our interactions with math, our experiences with other people while doing math, and the messages we see daily about mathematics.

What can we do as teachers, and as parents, to address negative stereotypes about mathematics?

Reflection on How to Learn Math: User interface matters

I’m participating in Dr. Jo Boaler’s course "How to learn mathematics" which started two days ago. Here are my observations so far:

  1. I like the structure of the ideas Dr. Boaler has presented so far. The "quizzes" we have done so far seem not to have right answers, and are more designed to make us think. The videos are short and engaging and easy to follow.
     
  2. The premise of the course is excellent, and I think that this kind of course is best held in a discussion style, with some ideas being seeded by the instructor, which looks like the purpose so far of the course.
     
  3. I read every single introduction people posted, and I was very impressed with people’s willingness to share that they have had poor experiences in math. I know that happens quite a bit (almost everyone I meet tells me they were terrible in math after I tell them what I do), but not so often in print, and I suspect not so often on the first day of a course. This almost certainly has something to do with the way Dr. Boaler framed the course which has clearly made people willing to start the course by candidly sharing their experiences.
     
  4. Unfortunately, the user interface for discussion is awful, which I know has nothing to do with Dr. Boaler, since she is very likely constrained in what platform she uses (given that she works at Stanford). This is also an issue that I brought up with respect to Dr. Keith Devlin’s course on Mathematical Reasoning.

Once I participate in a conversation, I can see no way of finding out if anyone has responded to my conversation without looking up the conversation in the long, long, long list of other conversations that have happened. I have no "home base" with which to find conversations for later. I actually used CTRL + F to search for my name after loading the very long welcome thread to find my name! My first recommendation for improving this is that the designers of Stanford’s course software should look at other forum software, much of which has evolved over at least a decade of use, and not try to recreate a new user interface for a standard forum discussion. My next recommendation is to offer a way for users to see, in one place, who has responded to something they have posted, and to be able to choose to receive notifications when someone responds. The discussion space should be more like Facebook, and less like Moodle.

Another issue I have noticed is that I seem to have to scroll through the conversations and load them as I scroll. This means that if I am interested in finding an older conversation, I may potentially have to spend many minutes scrolling through unwanted conversations looking for the one I want.

This issue around the usability of the discussion space is an important one, but this course is very interesting to me, and I intend to work with the discussion space as offered.


What evidence convinces teachers to change practices?

Research, by itself, rarely changes teacher practices. Presentations on why their practices should change rarely change teacher practices. Attending conferences rarely changes teacher practices (a teacher may adopt a few new things from a conference, but how often has a teacher come back from a conference and begun to teach in a completely new way?).

What does change teacher practice?

Eric Mazur, in his lecture "Confessions of a Converted Lecturer", recounts how standard measures told him his teaching style was sufficient, but when he applied a different measure, he was quite surprised to discover that his teaching had nearly no effect on his students’ conceptual learning of physics. The evidence that convinced Eric that his teaching needed improvement was the results of investigating his own teaching using a different tool, the force concept inventory. The key here is investigating his own teaching, not necessarily the tool he used.

In an essay titled, "How One Tutoring Experience Changed My Teaching", Sara Whitestone recounts how she discovered that the writer’s voice in their writing matters, and how she had to do more to help her students develop their own voices, rather than adopting the writing voice of their teacher. The tutoring experience is not what changed her teaching, it was her reflection on that tutoring experience that changed it, but the experience acted as a catalyst for this reflection.

When I asked the question, what evidence shifts teacher practices, on Twitter, I had a few responses, which could be summed up with these two tweets.


Why do teachers often ignore evidence? It is probably because the evidence they are presented is not grounded in their own experiences, but in narratives of experiences other people are describing. In other words, the way they are presented with the evidence is not supported by their experiences, and so they do not learn from it.

It seems therefore, that if we want teachers to change practices, one method which may work is to ask them investigate for themselves what their practices are, and participate in an inquiry into their own teaching practices.

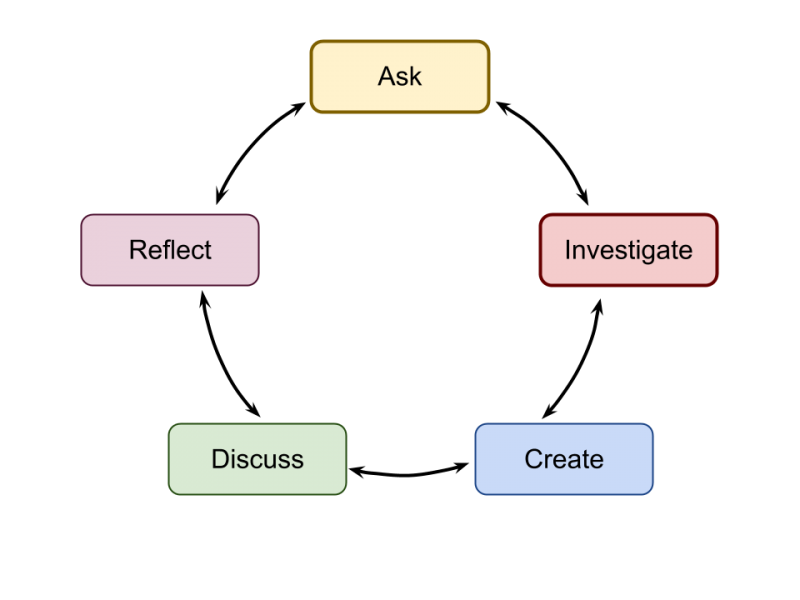
Ask, Investigate, Create, Discuss, Reflect
(Adapted from this)


What are some ways that you know are effective in promoting teacher growth and change of practices?

Ambiguity in mathematical notation

I’m reading Dylan Wiliam’s "Embedded Formative Assessment" book (which I highly recommend) and this paragraph jumped out at me:

"To illustrate this, I often ask teachers to write 4x and 4½. I then ask them what the mathematical operation is between the 4 and the x, which most realize is multiplication. I then ask what the mathematical operation is between the 4 and the ½, which is, of course, addition. I then ask whether any of them had previously noticed this inconsistency in mathematical notation — that when numbers are next to each other, sometimes it means multiply, sometimes it means add, some times it means something completely different, as when we write a two-digit number like 43. Most teachers have never noticed this inconsistency, which presumably is how they were able to be successful at school. The student who worries about this and asks the teacher why mathematical notation is inconsistent in this regard may be told not to ask stupid questions, even though this is a rather intelligent question and displays exactly the kind of curiousity that might be useful for a mathematician — but he has to get through school first!" ~ Dylan Wiliam, Embedded Formative Assessment, 2011, p53

Mathematical notation has been developing since the introduction of writing and has largely grown organically with new notation added as it is needed. In fact, if a mathematical concept is developed in different cultures, it is entirely likely that each culture will develop its own mathematical notation to describe the concept, and these mathematical notations inevitably end up competing with each other, sometimes for centuries.

This observation by Dylan Wiliam suggests to me that difficulties in mathematics for some students are almost certainly related to the notation that we use to represent it (especially in classrooms where mathematics is largely presented to students in completed form, rather than being constructed with students), and that people who end up good at math in school may be good at being able to switch meaning based on context.

Can you think of any other examples of mathematical notation which are potentially inconsistent with other mathematical notation? I’ll add one to get the list going:  which is clearly inconsistent with algebraic notation, and potentially with fractions too.

Students who are uninterested in math

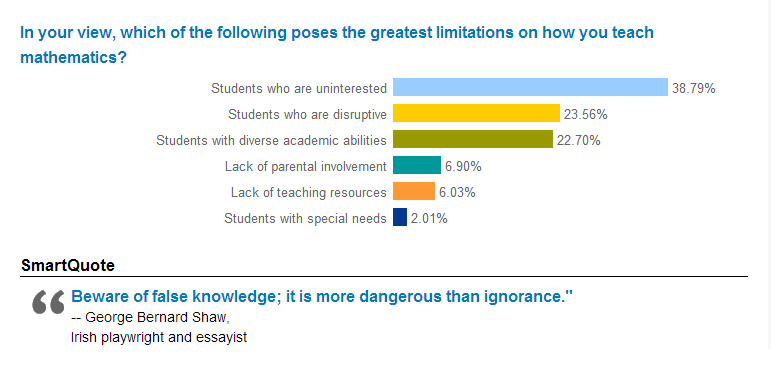
Results of the NCTM survey on why math is hard to teach

Source: NCTM Smartbrief


It seems to me that "students who are uninterested" is a problem of pedagogy. If that is what is holding students back from learning mathematics, then you should make your lessons more interesting. "Students who are disruptive" seems like another way of phrasing the first problem, but having worked in a challenging school myself, I do remember students who were challenging no matter how much I stood on my head to make my lesson interesting. That being said, both of these challenges are significantly less with good teaching. Students who are uninterested in what you teach are a sign that you should change your approach.

"Students with diverse academic abilities" is a serious problem, but it is (at least in part, see below) solvable. The basic trick is this, don’t teach everyone the same thing at exactly the same time. I would approach this particular issue with low-entry / high ceiling problem solving activities in small groups and then I workshop solutions with individual groups as I move around the classroom.

"Lack of a parental involvement" is definitely a huge issue. I think if you have interesting lessons and develop positive relationships with your students though you can mostly counteract the effects of parental apathy. My objective here is to set high standards for my students and their relationship with math like what I have for my own son.

"Lack of teaching resources." Uh… Have you heard of the Internet? Being a part of the Math Twitter Blogosphere means that lack of resources is never a problem. In fact, more resources than I can possibly use is more frequently the problem. Edit: It occurred to me that this may mean lack of physical resources, like pencils and paper, etc… in which case someone, somewhere, needs to rethink the priorities for their schools. Teachers and students should not lack for basic supplies.

For me the "students with special needs" problem can partially be addressed with using a problem solving approach with media that asks questions (like what Dan Meyer is curating with 101qs.com) for students for whom literacy is their barrier to mathematics. However, students with dyscalculia or who are many, many grade levels behind in their understanding of mathematics probably need more support. Having worked in a school that had minimal support for students with special needs many years ago, I definitely empathize with people who see this as a problem. 

The thing is about all of these responses is that not one of them is how I would answer this problem. For me, the things that I feel impose the greatest limitations on how I would teach (and most importantly, what I would teach) are the standards we are assigned to teach and the way students will be eventually externally assessed on those standards. I can certainly still teach in a creative way given these limitations, but they definitely place limitations on how I teach.

Designing open-ended tasks – Part 1

Designing an interesting and open-ended task is relatively easy. The challenging part comes when you attempt to use the task and learn something as a teacher about what your students understand.
 

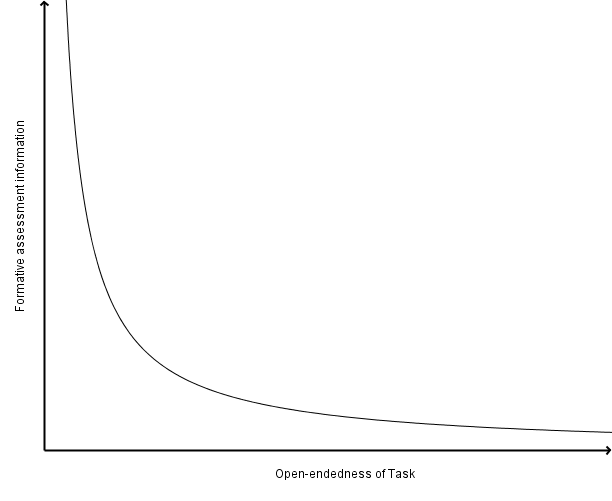
Graph of inverse relationship between open-ended tasks and formative assessment tasks
This graph represents the main issue that comes up when designing open-ended tasks for students to use; the more open-ended a task is, the less information you are likely to be able to gain from using the task. You can gain insight into what your students are thinking when they are working on an open-ended task, but chances are much greater that they have a much wider variety of insights and misconceptions that will come up during their time working on the task.

If we define "formative assessment" as "any tool used by teachers to gain insight into their student’s thinking and use that information for future planning of teaching and learning activities," then the open nature of these tasks helps with gaining insight into student thinking, but it makes planning future activities more challenging since we could potentially end up with much more information about what each student knows how to do, but potentially less information about what each student does not know how to do.

The very task that gives students the freedom to try many different potentially successful mathematics techniques to solve the problem unfortunately also limits how much of what we know of those paths that students chose not to follow. Did a student not use an algebraic approach because they don’t know algebra? Or did they use a non-algebraic approach because they didn’t think of an algebraic technique? Did they use a table to solve the problem because they love using tables? We have no time-efficient way of answering these questions.

One possible solution is to make sure that each time students work on a task, they have the opportunity to share their different solutions with each other. This way students who tend to use graphs to solve problems will see algebraic solutions to those same problems. Students who generally solve a problem using a table of values will see how other students used a diagram instead. By sharing different solutions created from the students amongst your class, students may be able to add to their own toolbox of methods they can use to approach problems.

The problem with this last solution is that this only works when the students are working on essentially the same problem; it will fail to work when the task is so open-ended that students have sufficient influence over the questions they ask. Maybe there are some other solutions to this problem?

In a future post, I will take a task and create different versions of it, sliding along the scale of open-endedness, and hopefully this will lead to some insights as to the challenge involved in open-ended tasks.

130 years of climate change data

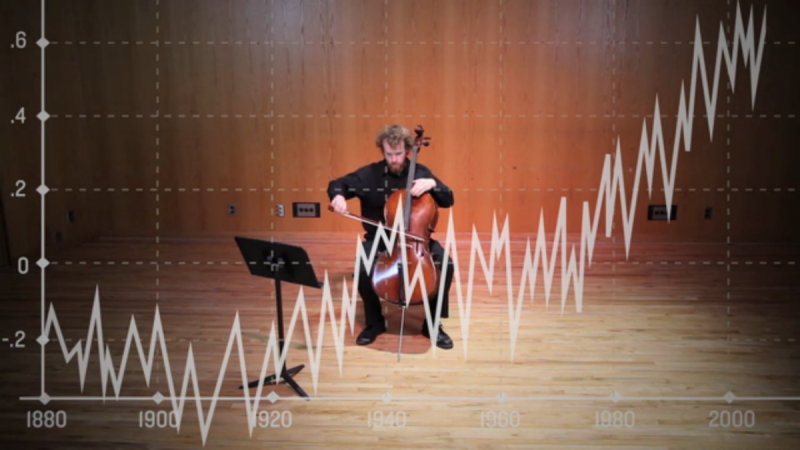
 Average temperature graph

Daniel Crawford is working on an interesting problem; how can we represent data about climate change in other ways. Each note he plays represents the average temperature for a year, with higher pitched notes representing higher temperatures. While I wouldn’t call this piece very musical, it is a very interesting and useful way to represent data about average temperatures.

Once people understand that our world is getting warmer, and significantly so, the next step is to wonder why. I’m interested to see what it would sound like if they overlaid these graphs with graphs of the average parts per million of various gases known to be associated with the greenhouse effect, and played by different instruments.