I’m working on a simple project to explain to students the importance of learning integration (which is an important technique in Calculus). The basic idea is this, take a model of something from the real world, like a car for example, and find the area represented by the model. You can talk about the importance in figuring out how much the metal will cost to make the car, or how much paint is required to cover the car, etc…
Here’s how we are going to do it in my class.

First we use our friend Google Image search and find a model. I found some great models from http://carblueprints.info and settled on a 1931 Ford Window Coupe as an example. It’s not clear to me what license these images are under, but given that I am using them exclusively for educational purposes and that there is no commercial value in what I am doing, I’m probably okay to use them here.
Once I had an image, I cropped it down somewhat and resized it. This was to make it more convenient to embed in my favourite graphing program, Geogebra. You could very easily use any graphing program here, or even print out the image and do the rest of this project on paper.
The next step was to open up Geogebra and insert the image. Lots of tutorials on how to do this and push the image into the background, and of course the steps will vary depending on which program you use. Once I had the image in Geogebra, I added points around the edge of the image at the critical parts of the model. I basically want to split the edges of the model into the different functions.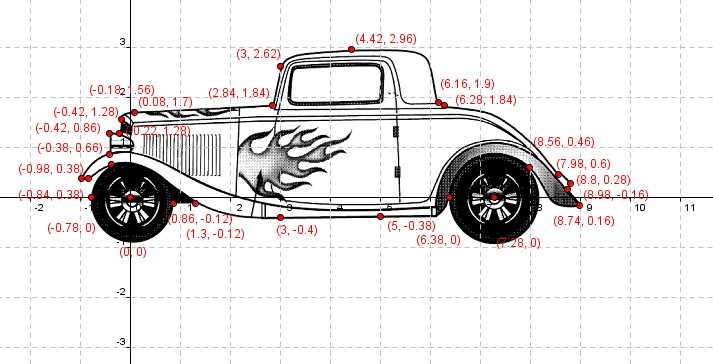
Once you have the coordinate point, which are the difficult things to find really, you can now use all sorts of techniques to find the functions. For example, which a less advanced class, they could approximate the shape given using straight lines. For a more advanced class, they could use lines, circles, polynomials, whatever to find the functions which represent the shape of the curves.
One nice option here is to either use the regression tool on a graphing calculator, or available in Excel to find the functions as appropriate.
Once you have the many functions which represent the shape, the students will have to find the x bounds of the functions (which should be easy if they have recorded the coordinate points) and then integrate each function over the appropriate bounds. One thing that could get students stuck at this stage is remembering that if they actually want to find the area ABOVE the curve, they will need to either flip their function over the x-axis, or more easily, find the absolute value of their negative answer for the integration of that function.
This activity allows for all sorts of differentiation (in terms of pedagogy, not calculus!) as well. Students who might struggle can be encouraged to choose easier models to begin with. You can also point out that some areas of the shape might be better done using actual area formula instead of integration or potentially this same type of activity could be used at a much lower level of mathematics using just area formula. These models represent excellent examples of composite areas, and their realism will help students recognize the relevance of what they are learning.
I haven’t actually gone through the entire process of the integration itself. I’m going to be using this activity with my students today and I don’t want to give it all away yet! Wait for me to post some examples of their work when they finish.
David Miles says:
Wow, that’s a very, very cool idea. In some ways it’s an extension of the Functions & Logos project we did at Southbank. If I have the time, I’m going to get my HLs to do this. Ideally my grade 11s, as a precursor to modelling.
Hey, on another (related) note, you need a copy of ‘The Geek Atlas: 128 Places Where Science and Technology Come Alive’, ISBN-10: 0596523203. It’s fascinating, and I’ve got a bunch of ideas to do with maths in the real world from it (Did you know the shape of the Eiffel Tower is an exponential curve? The curve of a cable for a suspension bridge starts off as a catenary but becomes quadratic when the road is laid?)
And this book, ‘Project Origami: Activities for Mathematics Classes’, ISBN-10: 1568812582. Also fantastic – you can find it in Google Books and read some of it before buying – I’ve done the quadratics activity with my grade 11 HLs.
December 21, 2009 — 10:27 am