There is evidence that students who have access to and understand how to use different mathematical representations of the same mathematical concepts are more successful learning mathematics than students who only have access to one representation type.
The issue is that mathematical representations are not intrinsically meaningful on their own. Some mathematical representations are completely arbitrary and for others it can be challenging to determine to what elements of the representation to pay attention.
Here is an example intended to highlight how some mathematical representations, even ones that are very familiar, are somewhat arbitrary. Check out the diagram below and ask yourself, “What is meant by each of these models for the less than, equals to, and greater than signs?”
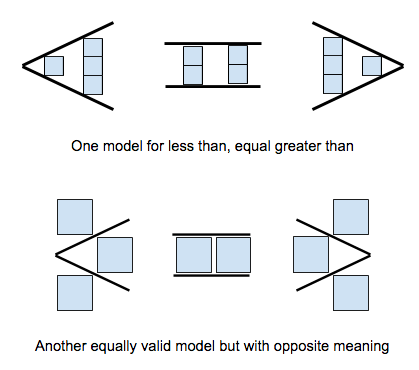
The less than, equals to, and greater than signs are arbitrary. They are symbols to which we denote meaning and which otherwise do not contain any mathematical information without that meaning assigned.
Another issue is that students do not always attend to the critical features of a mathematical representation. For example, I have often seen a shape and a formula for calculating the area of that shape introduced together, possibly like it is shown below with a calculation of area alongside the visual.
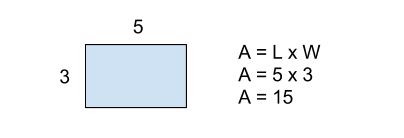
But to what exactly in this representation do we expect students to attend? The most obvious features of the diagram of the rectangle that correspond to the area formula are the 5 and the 3. These refer to the quantities of length and width. But what is meant by the multiplication of those two quantities? How is this multiplication represented in the diagram? There is no special reason from diagrams like these that children will attend to the space occupied by the rectangle and match that to the area of the rectangle, so we need to find ways to draw their attention to this element of rectangles.
Mathematical representations have potential power to subtly introduce ideas to students as well. The number line is a good example of a representation that is often introduced early and may lead to some powerful questions by students.
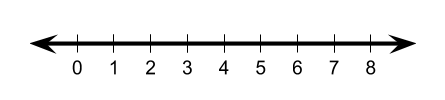
What do those arrows on either side mean?
What does the space between the numbers represent?
What does going left on the number line mean?
When does the number line stop?
Each of these questions has a mathematical answer and the number line can again be used to represent this answer (warning: but not always very well).
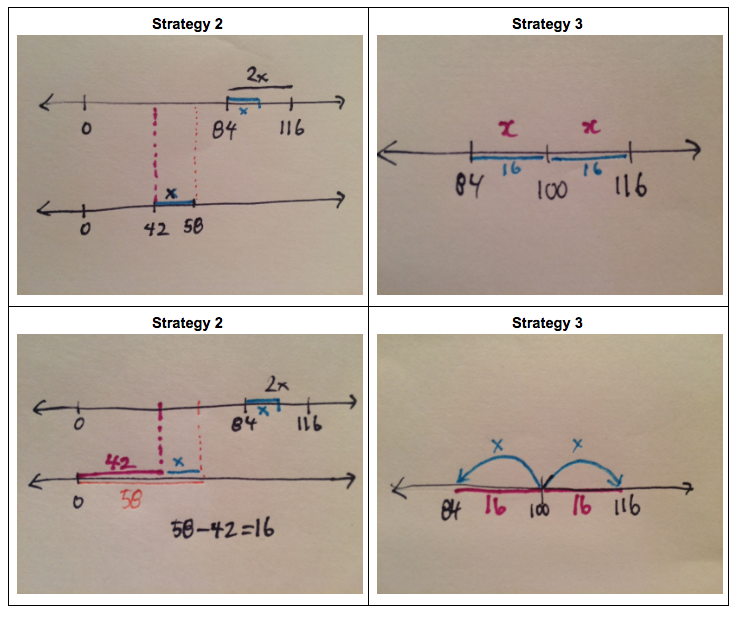
I worked recently with a group of teachers, and we looked for shortcuts to solving the equation x + x = 116 – 84.
Here are some of their shortcuts.
| Strategy 1 | Strategy 2 | Strategy 3 |
|---|---|---|
| “I combined the x’s together and I subtracted the 84 from the 116, which gave me 32. I could do this quickly because I knew that 11 – 8 = 3 and 6 – 4 = 2. This gave me 2x = 32, so then I divided both sides by 2 to get x = 16.” | “I saw the x + x and changed it to 2x. Then I decided to divide everything by 2 to make the calculation simpler, and got x = 58 – 42. Since 58 – 42 is 16, this means x = 16.” | “I noticed that 116 and 84 are both 16 away from 100. So I can rewrite this as x + x = 16 + 16 and therefore x = 16.” |
But what if we tried to represent Strategy 2 and 3 on a number line? Here are a couple of different visualizations of these strategies. What information is captured differently by the different visualizations?
In our math curriculum, when introducing an area model for factoring and completing the square, we first introduce the representation itself before we do any other mathematical work using it.
Try out this applet and ask yourself, “What relationships between the visual and the expression do you notice as you change the value of a?”
In a classroom setting, we could ask students to share their answers to this prompt with a partner and then we could ask some students to share their answers with the entire class. After this, if necessary, we could add an observation from another class, so that students know to what elements of this representation to attend.
Next, after students practice writing out expressions for unaltered diagrams, we could ask students to write expression for the following altered diagrams:
In my experience, this geometric approach to completing the square results in more students in having access to the algebraic approach, and makes the name of the algebraic strategy more obvious.
Mathematical representations can offer explicit ways for students to make connections across different mathematical topics. In our Algebra I curriculum, we do not have a unit on graphing. Instead interpreting and using graphs is part of all seven units, increasing the odds students make connections in and between those units and also that students remember key ideas from the course.
To summarize:
- Don’t assume that mathematical understanding is transmitted by the representation.
- Some mathematical ideas are easier to introduce using some representations rather than others.
- Reusing a specific mathematical representation over and over again will both help students make mathematical connections and remember key concepts from the year.